INTRODUCTION
Cold stress below suitable temperature can affect physiological activities of photosynthetic organisms including plants and algae (Shin et al. 2016, Aslam et al. 2022). For land plants, the response mechanism to cold stress has been systematically analyzed involving complex matrix processes (Ding et al. 2019). However, for algae, there are relatively few studies on their response to cold stress both on physiology and transcriptome. Several researches mainly focused on the microalgae such as snow algae, Antarctic ice algae, and model species of Chlamydomonas rheinensis, but few researches carried on macroalgae (Dong et al. 2012, Ermilova 2020, Wang et al. 2020b, Zhang et al. 2020).
On physiologically, cold stress on algae usually firstly affects the photosynthetic efficiency and pigment contents (Green and Neefus 2015). Under low-temperature stress, the irradiance-saturated rate of photosynthesis (Pmax) decreased in red macroalga Gracilariopsis lemaneiformis (Zou and Gao 2014), so did the synthesis of phycobilin in Pyropia yezoensis (Takahashi et al. 2020). In C. reinhardtii, the growth decreased due to due to photooxidative damage of several macromolecules under low temperatures (Zheng et al. 2020, Kaur et al. 2022). For microalgae Phaeodactylum tricornutum, both cell density and biomass were significantly reduced under different gradients of cold stress, indicating an adverse effect on its normal growth and development (Ren 2011). In macroalgae, under low temperatures of 0 and 5°C, the thalli of P. yezoensis grew slowly, and its growth in length and width was significantly lower than that under 10°C (Takahashi et al. 2020). Cold temperature of 4°C within 14 days inhibited the growth of Porphyra haitanensis thalli, on the contrary, kept the growth at 10°C and enhanced growth at 20°C (Zhu et al. 2022).
On transcriptome level, some specific genes differentially expressed under cold stress. The genes encoding fatty acid desaturase, heat shock protein, histone acetyltransferase and bZIP transcription factor were differentially regulated (Sun et al. 2015). Basically, gene expression is more sensitive than physiological response, and could respond to cold stress in advance. In red macroalga P. haitanensis under low temperature of 4°C (optimal temperature 20–22°C), even no effect on gametophyte health and photosynthetic efficiency on, however, on transcriptome level, obvious down-regulation happened in genes associated with the photosynthetic system, carbon fixation and primary metabolic biosynthesis (Zhu et al. 2022). In G. lemaneiformis, the expression of key genes involved in unsaturated fatty acid synthesis and basic excision repair pathways was significantly up-regulated after 6-h 5°C low-temperature treatment, and those key genes involved in the glutathione synthesis pathway was promoted after 24 h (Qin et al. 2021).
Cold acclimation has been observed in both micro- and macroalgae. In snow alga Chlamydomonas nivalis, photosynthetic activity was maintained by reducing the light-harvesting ability of photosystem II (PSII) and enhancing the cyclic electron transfer around photosystem I, both of which limited damage to the photosystem from excess light energy and resulted in ATP production, supporting cellular growth and other physiological processes (Zheng et al. 2020). Calhoun et al. (2021) reported an increase in the expression of genes that encode fatty acids, metabolic enzymes, and variations in the levels of amino acids under cold stress in a halotolerant microalga Scenedesmus. Menegol et al. (2017) demonstrated increased ω3-fatty acids production in Heterochlorella luteoviridis under low temperature. In Chlamydomonas reinhardtii, transcription factors differentially expressed upward along with cold exposure time, including bZIP, MYB, and ERF family (of AP2/EREBP superfamily) (Li et al. 2020). In macroalgae, physiological analysis showed that some specific biochemicals increase during exposure to cold stress and could enhance their acclimation. For instance, high content of antioxidants such as superoxide dismutase, peroxidase, and ascorbate peroxidase could enhance the cold tolerance of Kappaphycus alvarezii (Li et al. 2016). In kelp, ubiquinol oxidase could reduce reactive oxygen species production under low temperature, and glutathione S-transferase also related to temperature adaptability (Monteiro et al. 2019). In P. haitanensis, increased unsaturated fatty acids improve membrane fluidity, increased frydoside and isofrydoside enhance osmotic resistance, and some plant hormones (abscisic acid, salicylic acid, and methyl jasmonate) are also associated with cold resistance (Zhu et al. 2022).
Inhabiting naturally in the intertidal zone, red macroalga P. yezoensis is exposed to substantially fluctuated temperature, especially to cold stress during growth season of its gametophyte thalli stage. Simultaneously, as a high valuable cultivated marine crop, its acclimation to cold stress is especially important for long cultivation period across winter in warm temperate coasts of East Asia. This study aimed to explore response mechanisms of P. yezoensis to cold stress on the physiological and transcriptional level. The results may not only help in understanding the molecular mechanism in response to environmental stress, but also provide basic information for genetic breeding in economic macroalgae.
MATERIALS AND METHODS
Algae culture and treatment
The pure line PY440 RZ of P. yezoensis from our Laboratory of Algae Genetics and Breeding (Ocean University of China) was used. The gametophytic thalli were cultured in bubbling sterilized seawater with Provasoli’s enrichment solution medium under 50 μmol photons m−2 s −1 at 10°C and a 12 : 12 light : dark (L : D) photoperiod. In our previous experiments, it was shown that low-temperature of 2°C influenced more significantly than 4°C on the growth, photosynthetic activity, and pigment contents of PY440 RZ with the same trend during 6 days, comparing to suitable temperature of 10°C. And considering the average temperature in cultivated areas could drop to ~2°C during winter, 2°C was used as low-temperature treatment. The 2–3 cm healthy thalli were selected for the treatments. Each treatment set three replicates, measured growth and photophysiological parameters, and took RNA-Seq samples for frozen at 0, 2, 6, 24, and 48 h.
Measurement of growth and photophysiology
Growth
The thalli were spread and taken photos by camera. The thalli areas were calculated using ImageJ software (National Institutes of Health, Bethesda, MD, USA). The daily growth rate (DGR) was assessed according to the formula DGR (% d−1) = [(At/A0)1/t − 1] × 100% (A0 refers to the initial area and At refers to the area after t days) following Zhong et al. (2023).
Photophysiology
Photosynthetic activity of thalli was measured using chlorophyll fluorescence imaging system (FluorCAM MF800; PSI, Drasov, Czech) as our previous work (Du et al. 2022). Ten minutes dark-adaption was taken for samples before measurements. The photosynthetic parameters of maximum PSII quantum yield (Fv/Fm), effective PSII quantum yield [QY(II)], non-photochemical quenching (NPQ), and photochemical quenching (qP) were derived from quenching analysis.
Pigments
After precisely weighing, each sample was ground with liquid nitrogen. The extraction of phycoerythrin (PE), phycocyanin (PC), allophycocyanin (APC), and chlorophyll a (Chl a) and the calculation of their contents were made according to Cao et al. (2021).
All the data were presented as mean value with standard deviation, one-way ANOVA, and Tukey tests were used to analyze differences among treatments by SPSS version 17.0 (SPSS Inc., Chicago, IL, USA).
Gene expression on genome level
RNA extraction and differential expression analysis
Total RNA of all samples was extracted by HP Plant RNA Kit (OMEGA BioTek Co., Guangdong, China). The quality and concentration of RNA samples was examined strictly through Agarose gel electrophoresis, Nanodrop 2000 (OD260/280 and OD260/230 ratio; Thermo Fisher Scientific, Wilmington, DE, USA) and Agilent 2100 bioanalyzer (Agilent Technologies, Santa Clara, CA, USA). Then cDNA library was constructed and sequenced following previous work (Sun et al. 2015). RNA-Seq data of all time points were mapped to the P. yezoensis reference genome (Wang et al. 2020a) using RSEM (RNA-Seq by expectation maximization) (Li and Dewey 2011). The expression levels of transcripts and differentially expressed genes (DEGs) were determined by RPKM (reads per kilo bases per million mapped reads) (Mortazavi et al. 2008). The DEGs between any two treatments were identified using DESeq2 (Love et al. 2014) based on readcount, with an false discovery rate (FDR) <0.05 and log2 fold change ≥1.
Gene ontology (GO), pathway enrichment, and co-expression network analysis
The specific groups of DEGs were analyzed using GOseq methods by Gene Ontology with p-value threshold <0.05 (Xie et al. 2011). The Kyoto Encyclopedia of Genes and Genomes (KEGG) pathway enrichment analysis for the DEGs was performed using KOBAS with the FDR threshold ≤0.05 (Xie et al. 2011). The co-expression networks were conducted using all the DEGs. The functional modules were determined using the Qcut co-expression network analysis method (Ruan et al. 2010). In a co-expression network, a node is defined as a gene and an edge is drawn between two genes with similar expression patterns (Pearson’s correlation coefficient >0.5). For each node in the network, the number of edges between it and other nodes was counted as its degree. The top 15% of nodes with high degrees were denoted as hubs.
Validation of gene expression
To validate the expression profiles in RNA-Seq, reverse transcription polymerase chain reaction (RT-PCR) was performed on six genes selected at random with high or low expression levels. The ACT3 gene was used as a reference to normalize the relative expression levels. The six selected genes were listed with their annotation and primer sequences (Table 1). Each quantitative PCR experiment was performed on the Applied Biosystems StepOnePlus Real-Time PCR Systems (Foster City, CA, USA) with three biological replicates (He et al. 2018).
RESULTS
Effects on growth and physiology
Growth
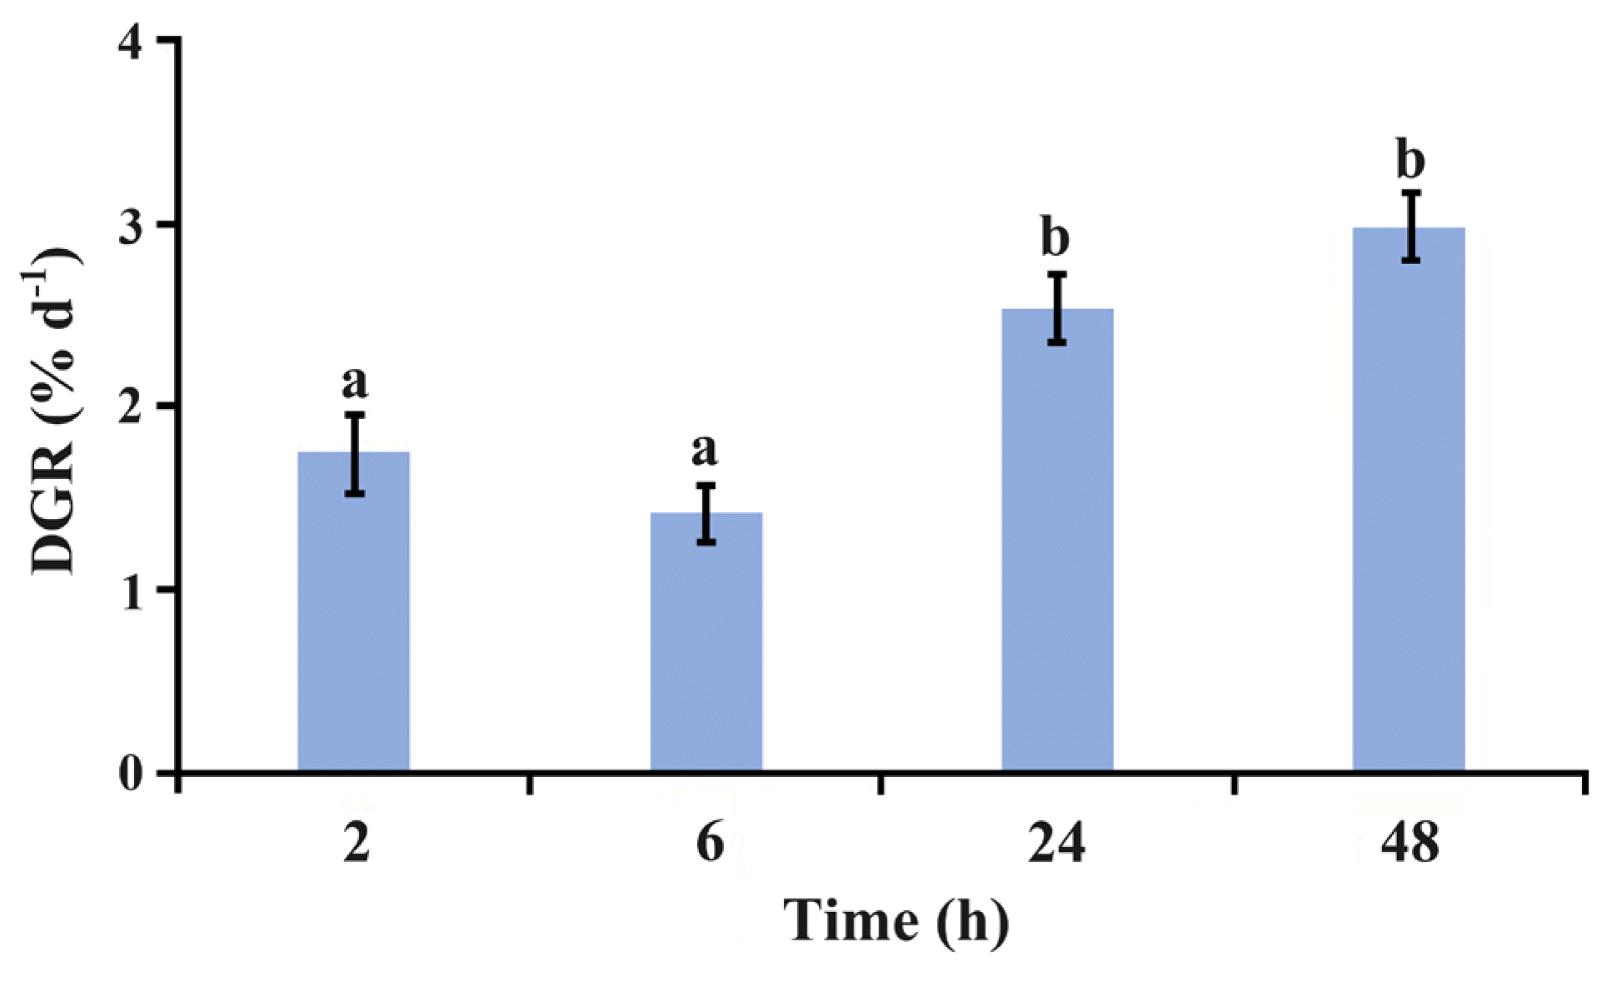
Under 2°C, the average growth rate of P. yezoensis thalli decreased from 2 to 6 h but not significantly (p > 0.05), and then increased significantly (p < 0.01) till to reach the maximum at 48 h (Fig. 1).
Photosynthesis
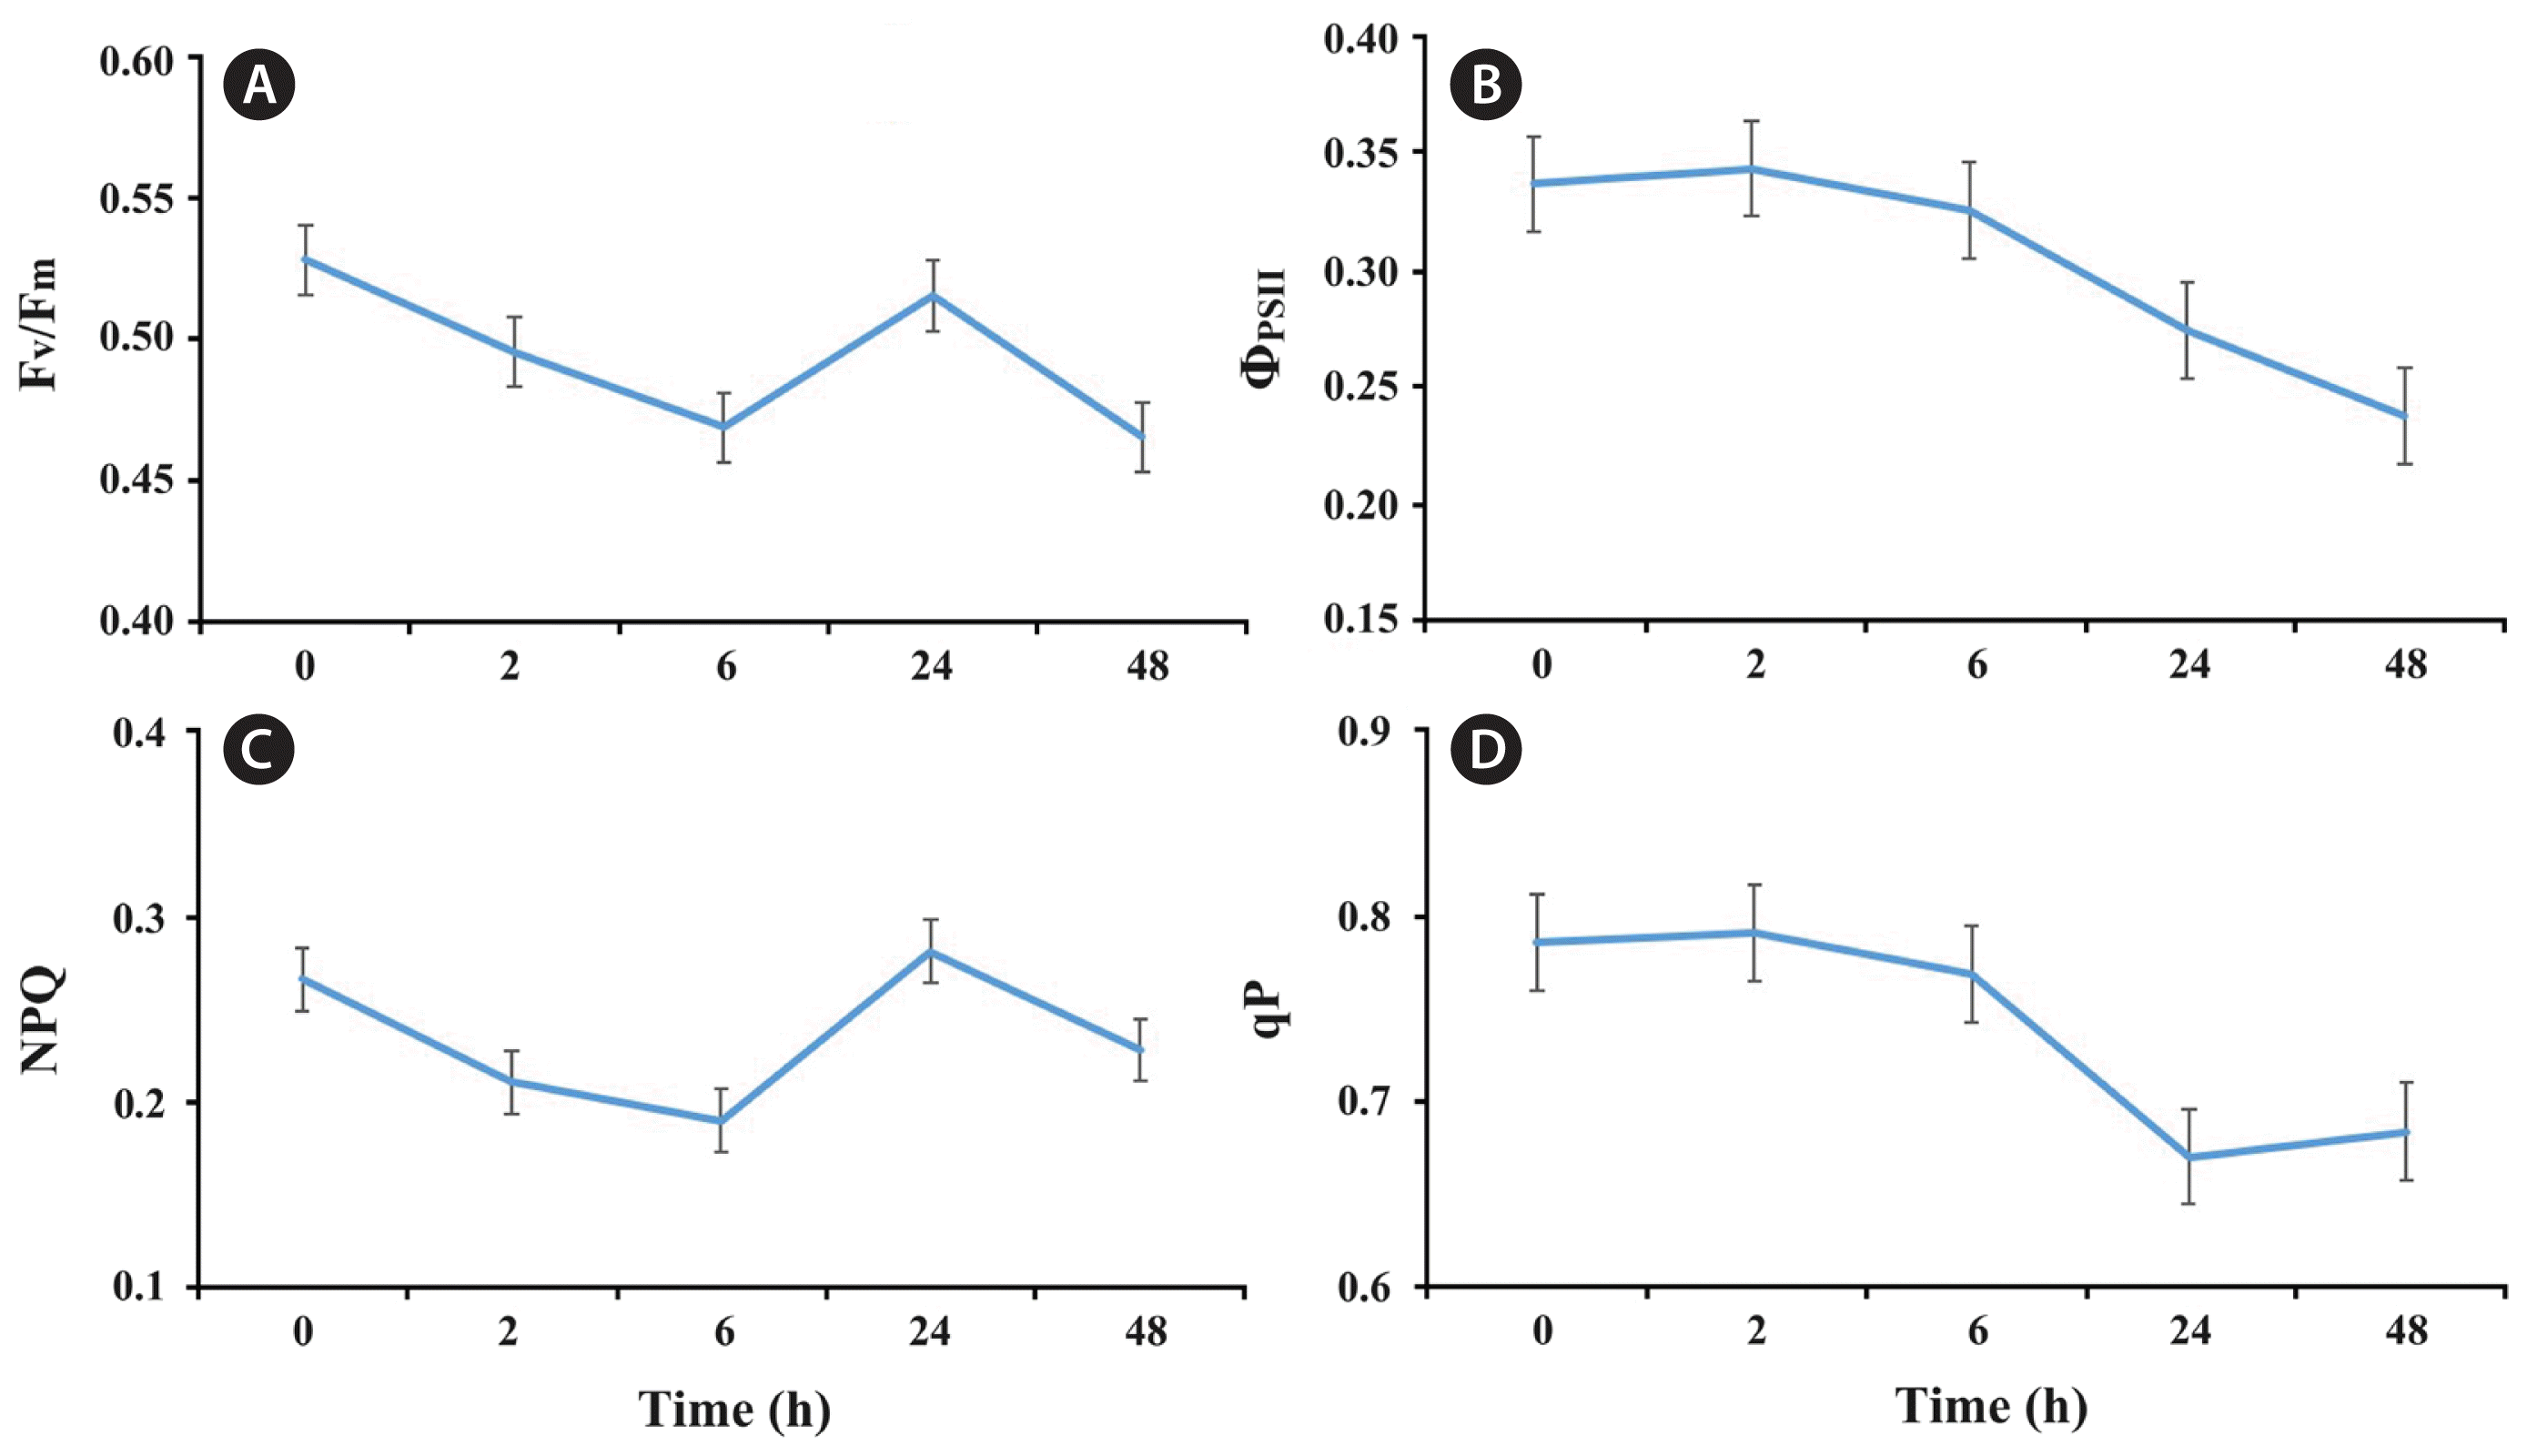
For the photosynthetic parameters, the variation of Fv/Fm and NPQ exhibited similar trends (Fig. 2A & C). Both of them decreased significantly (p < 0.01) during 2 h, and continually till to the minimum value at 6 h (p < 0.05), then increased significantly (p < 0.01) from 6 to 24 h, reaching its maximum value at 24 h. After 24 h, it began to decrease significantly again (p < 0.01). For ΦPSII, there was a slight increase but not significantly (p > 0.05) during 2 h, then decreased significantly (p < 0.01) till to the minimum value at 48 h (Fig. 2B). The qP also showed a slight but not significant increase at first and decreased till 24 h, and an insignificant increase (p > 0.05) from 24 to 48 h (Fig. 2D).
Pigment contents
In P. yezoensis thalli after 48 h, 2°C treatment, the content of APC decreased significantly (p < 0.05), and other three pigment contents of PE, PC, and Chl a changed insignificantly (Table 2).
Transcript analysis on response of cold stress
Sequencing and annotation of DEG libraries
The RNA-Seq results of total 15 RNA samples obtained 108.05 Gb Clean Data and each having at least 91.92% Q30 bases and average 66.5% GC contents. Approximately, 93.13–95.57% reads were mapped to reference genome of P. yezoensis (Table 3).
The correlation analysis showed the square of the Pearson correlation coefficient (R2) was greater than 0.92 within each group, indicating both operational stability and reliability.
DEG analysis
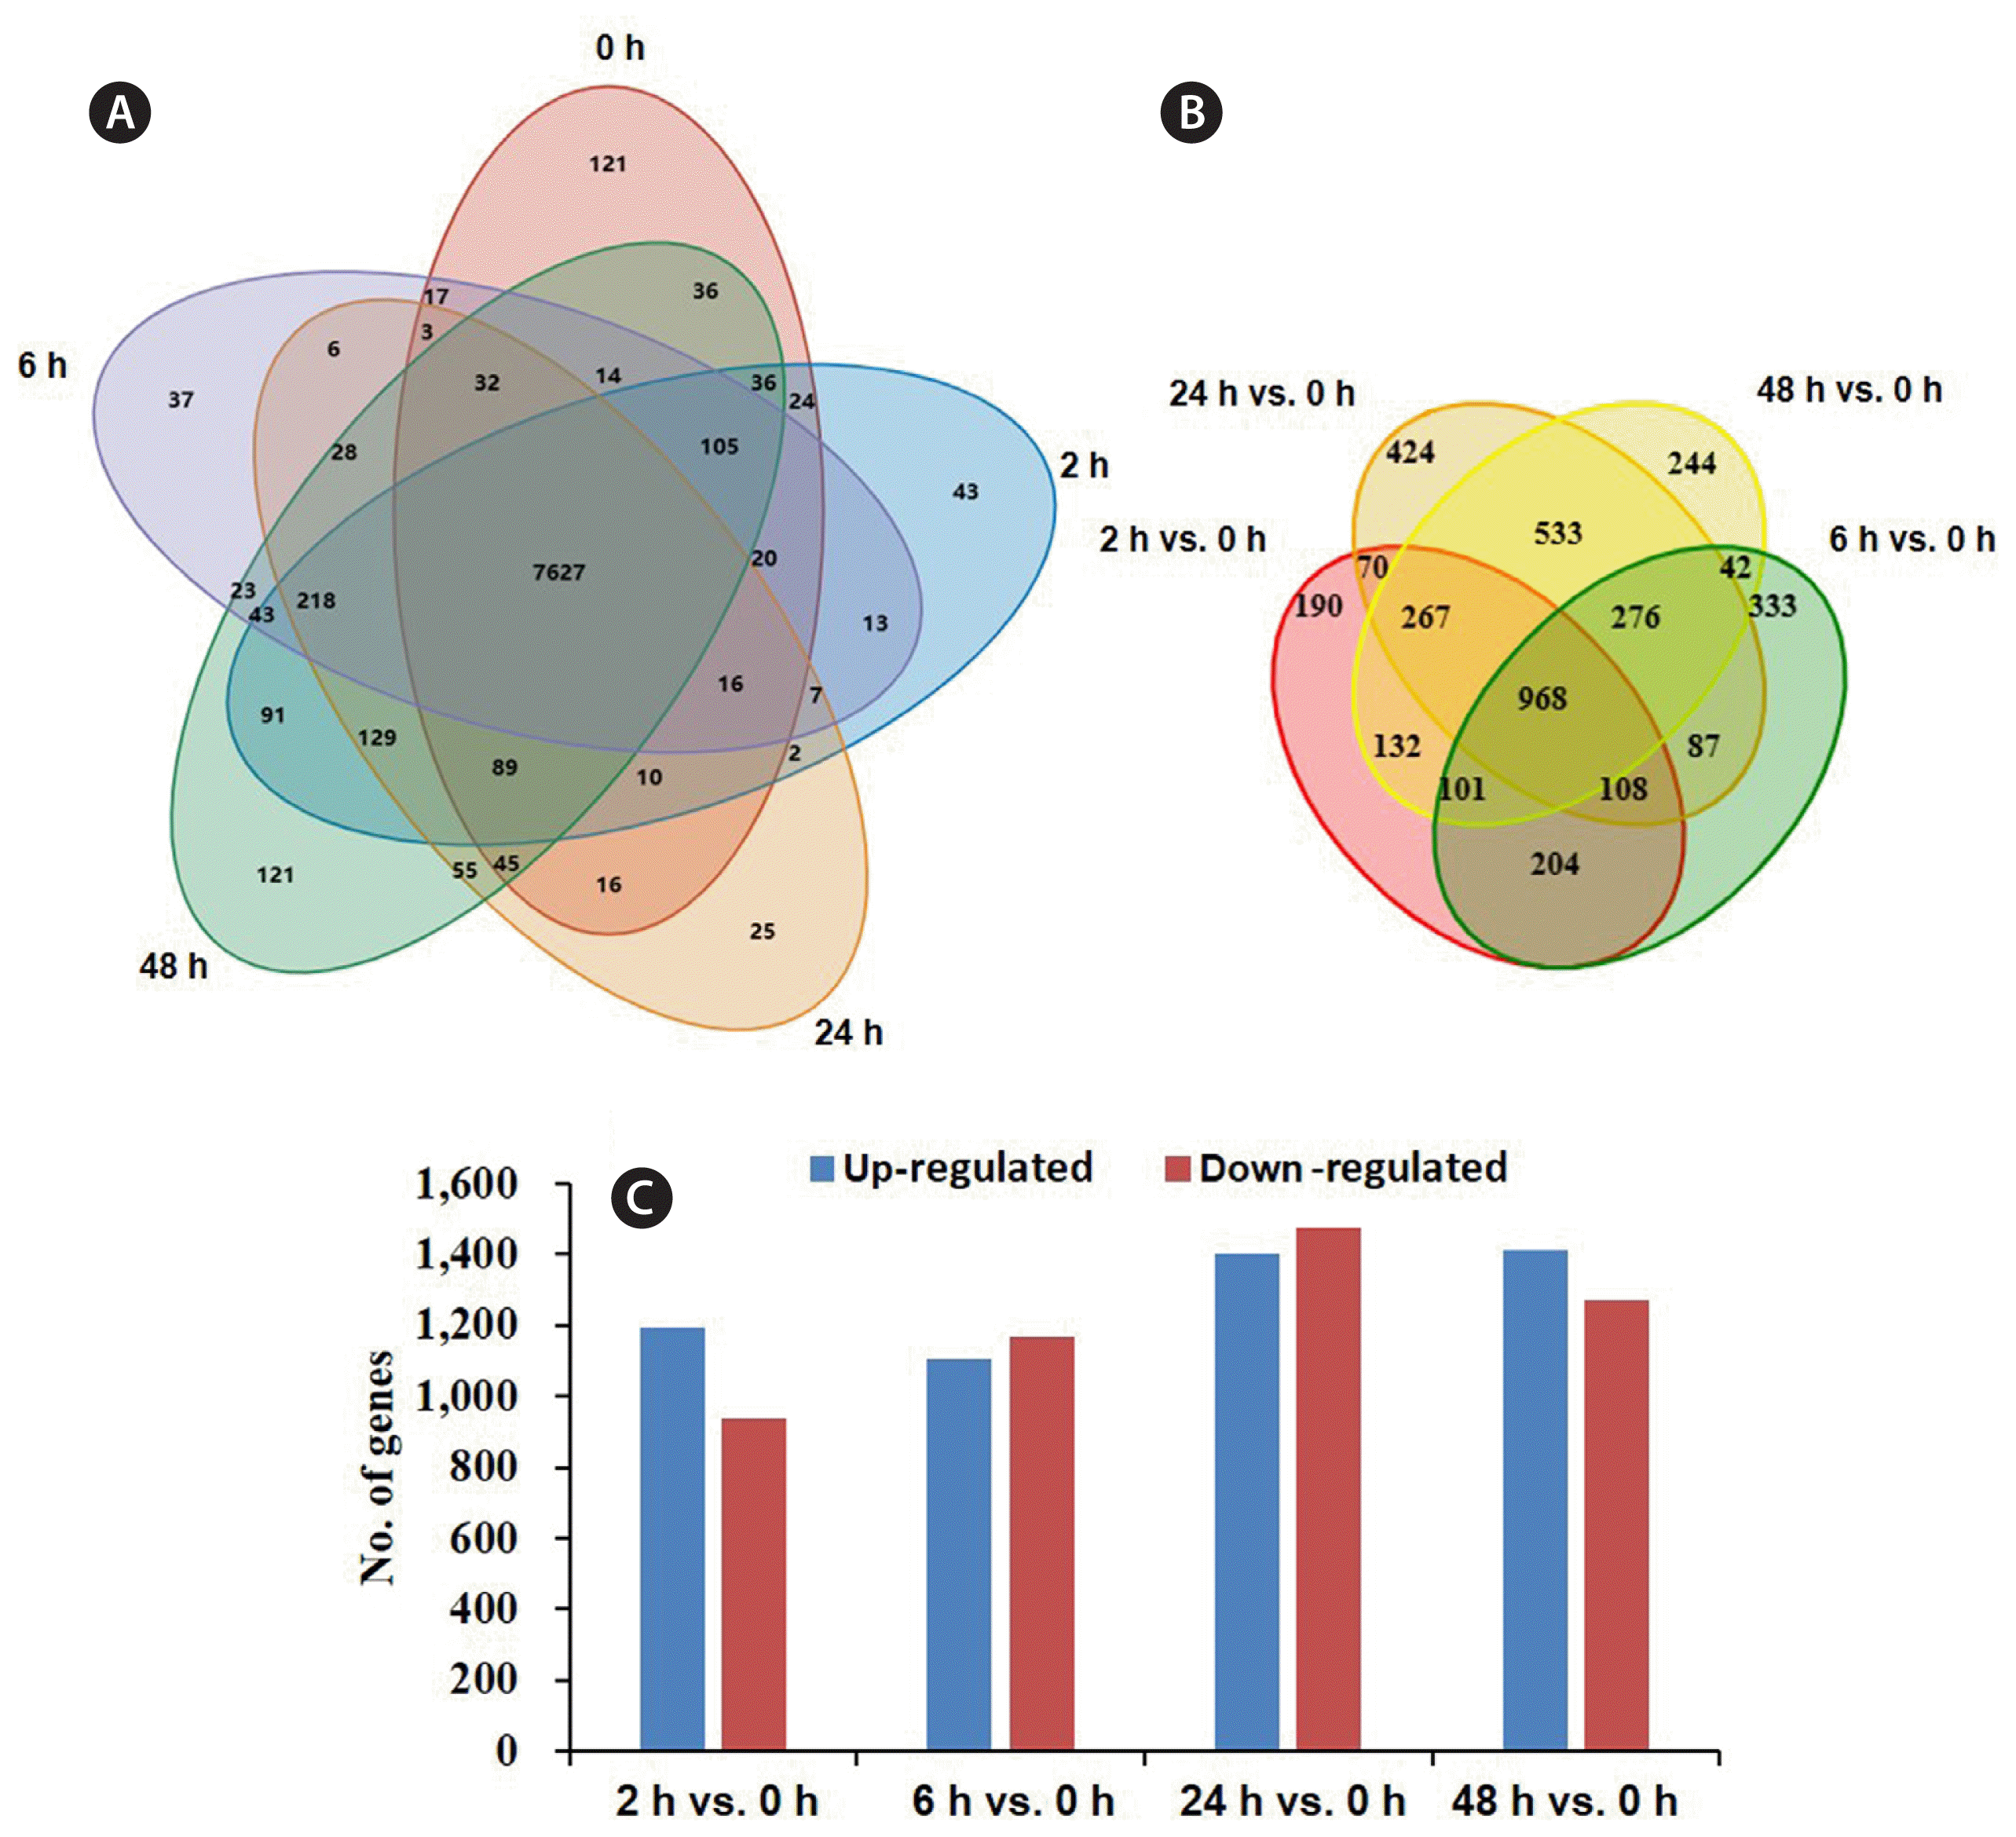
Total 9,052 expressed unigenes were obtained, of which 7,827 were found in all samples (Fig. 3A). The comparison showed unique genes of 0, 2, 6, 24, and 48 h were 121, 43, 37, 25, and 121, respectively (Fig. 3A). Differentially expressed sequence (DESeq) analysis identified 968 DEGs in all treatment times (Fig. 3B), and 2,134, 2,276, 2,881, and 2,688 DEGs in 2, 6, 24, and 48 h group compared with 0 h group, among them, the up- and down-regulated genes were occupied 50% or so (Fig. 3C).
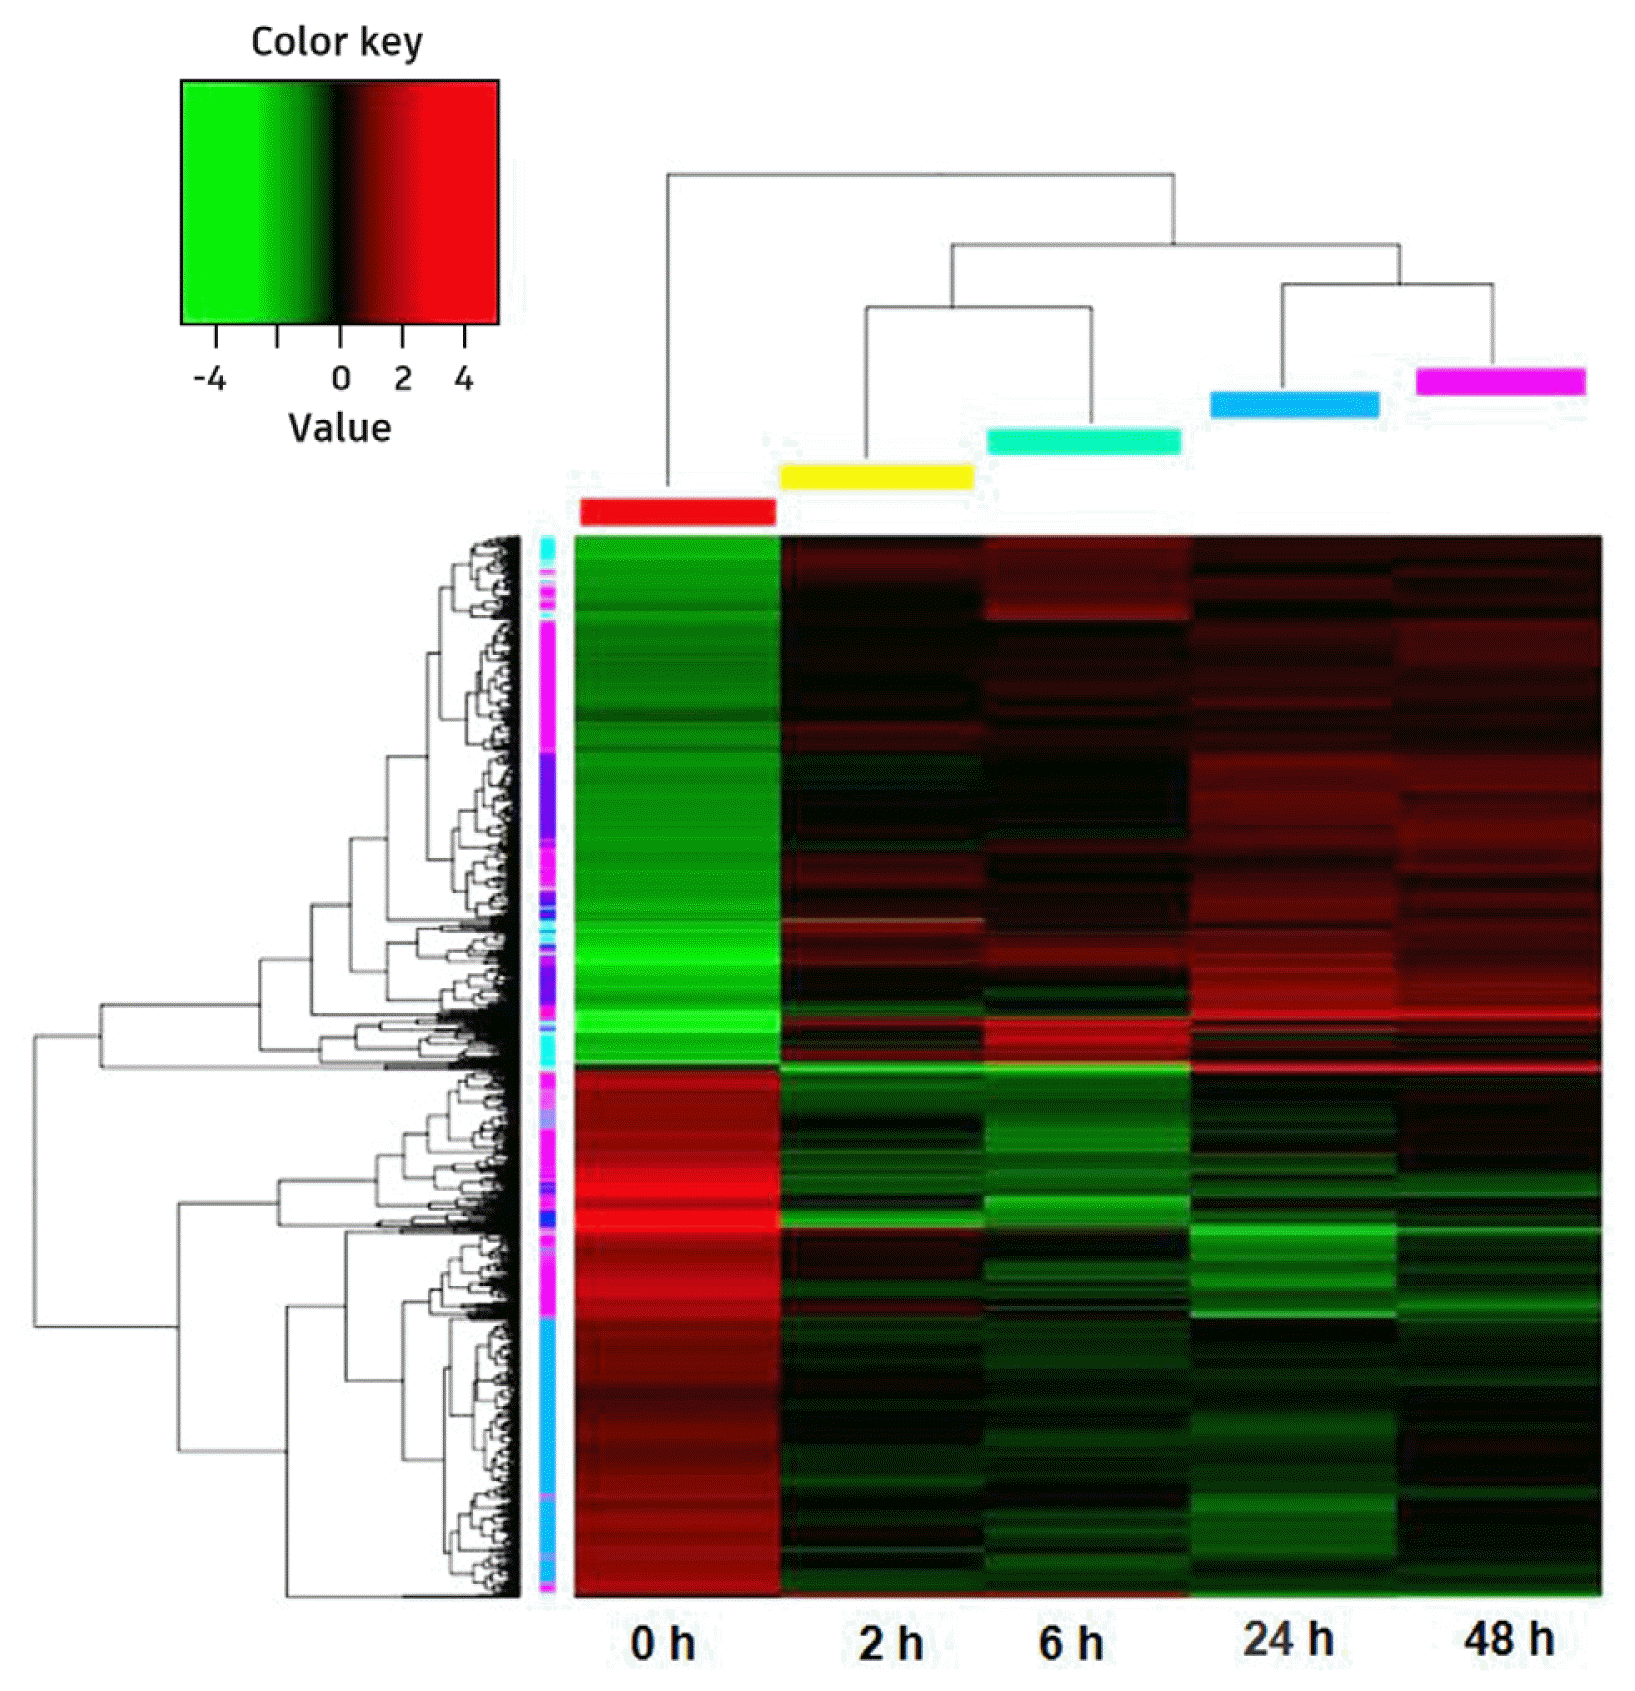
Hierarchical cluster analyzed common 968 DEGs of all five treatment times. It showed that the expression patterns of 2 and 6 h were similar, as were 24 and 48 h, while these four groups were remarkably different with 0 h (before cold treatment) (Fig. 4).
GO and KEGG analysis of DEGs
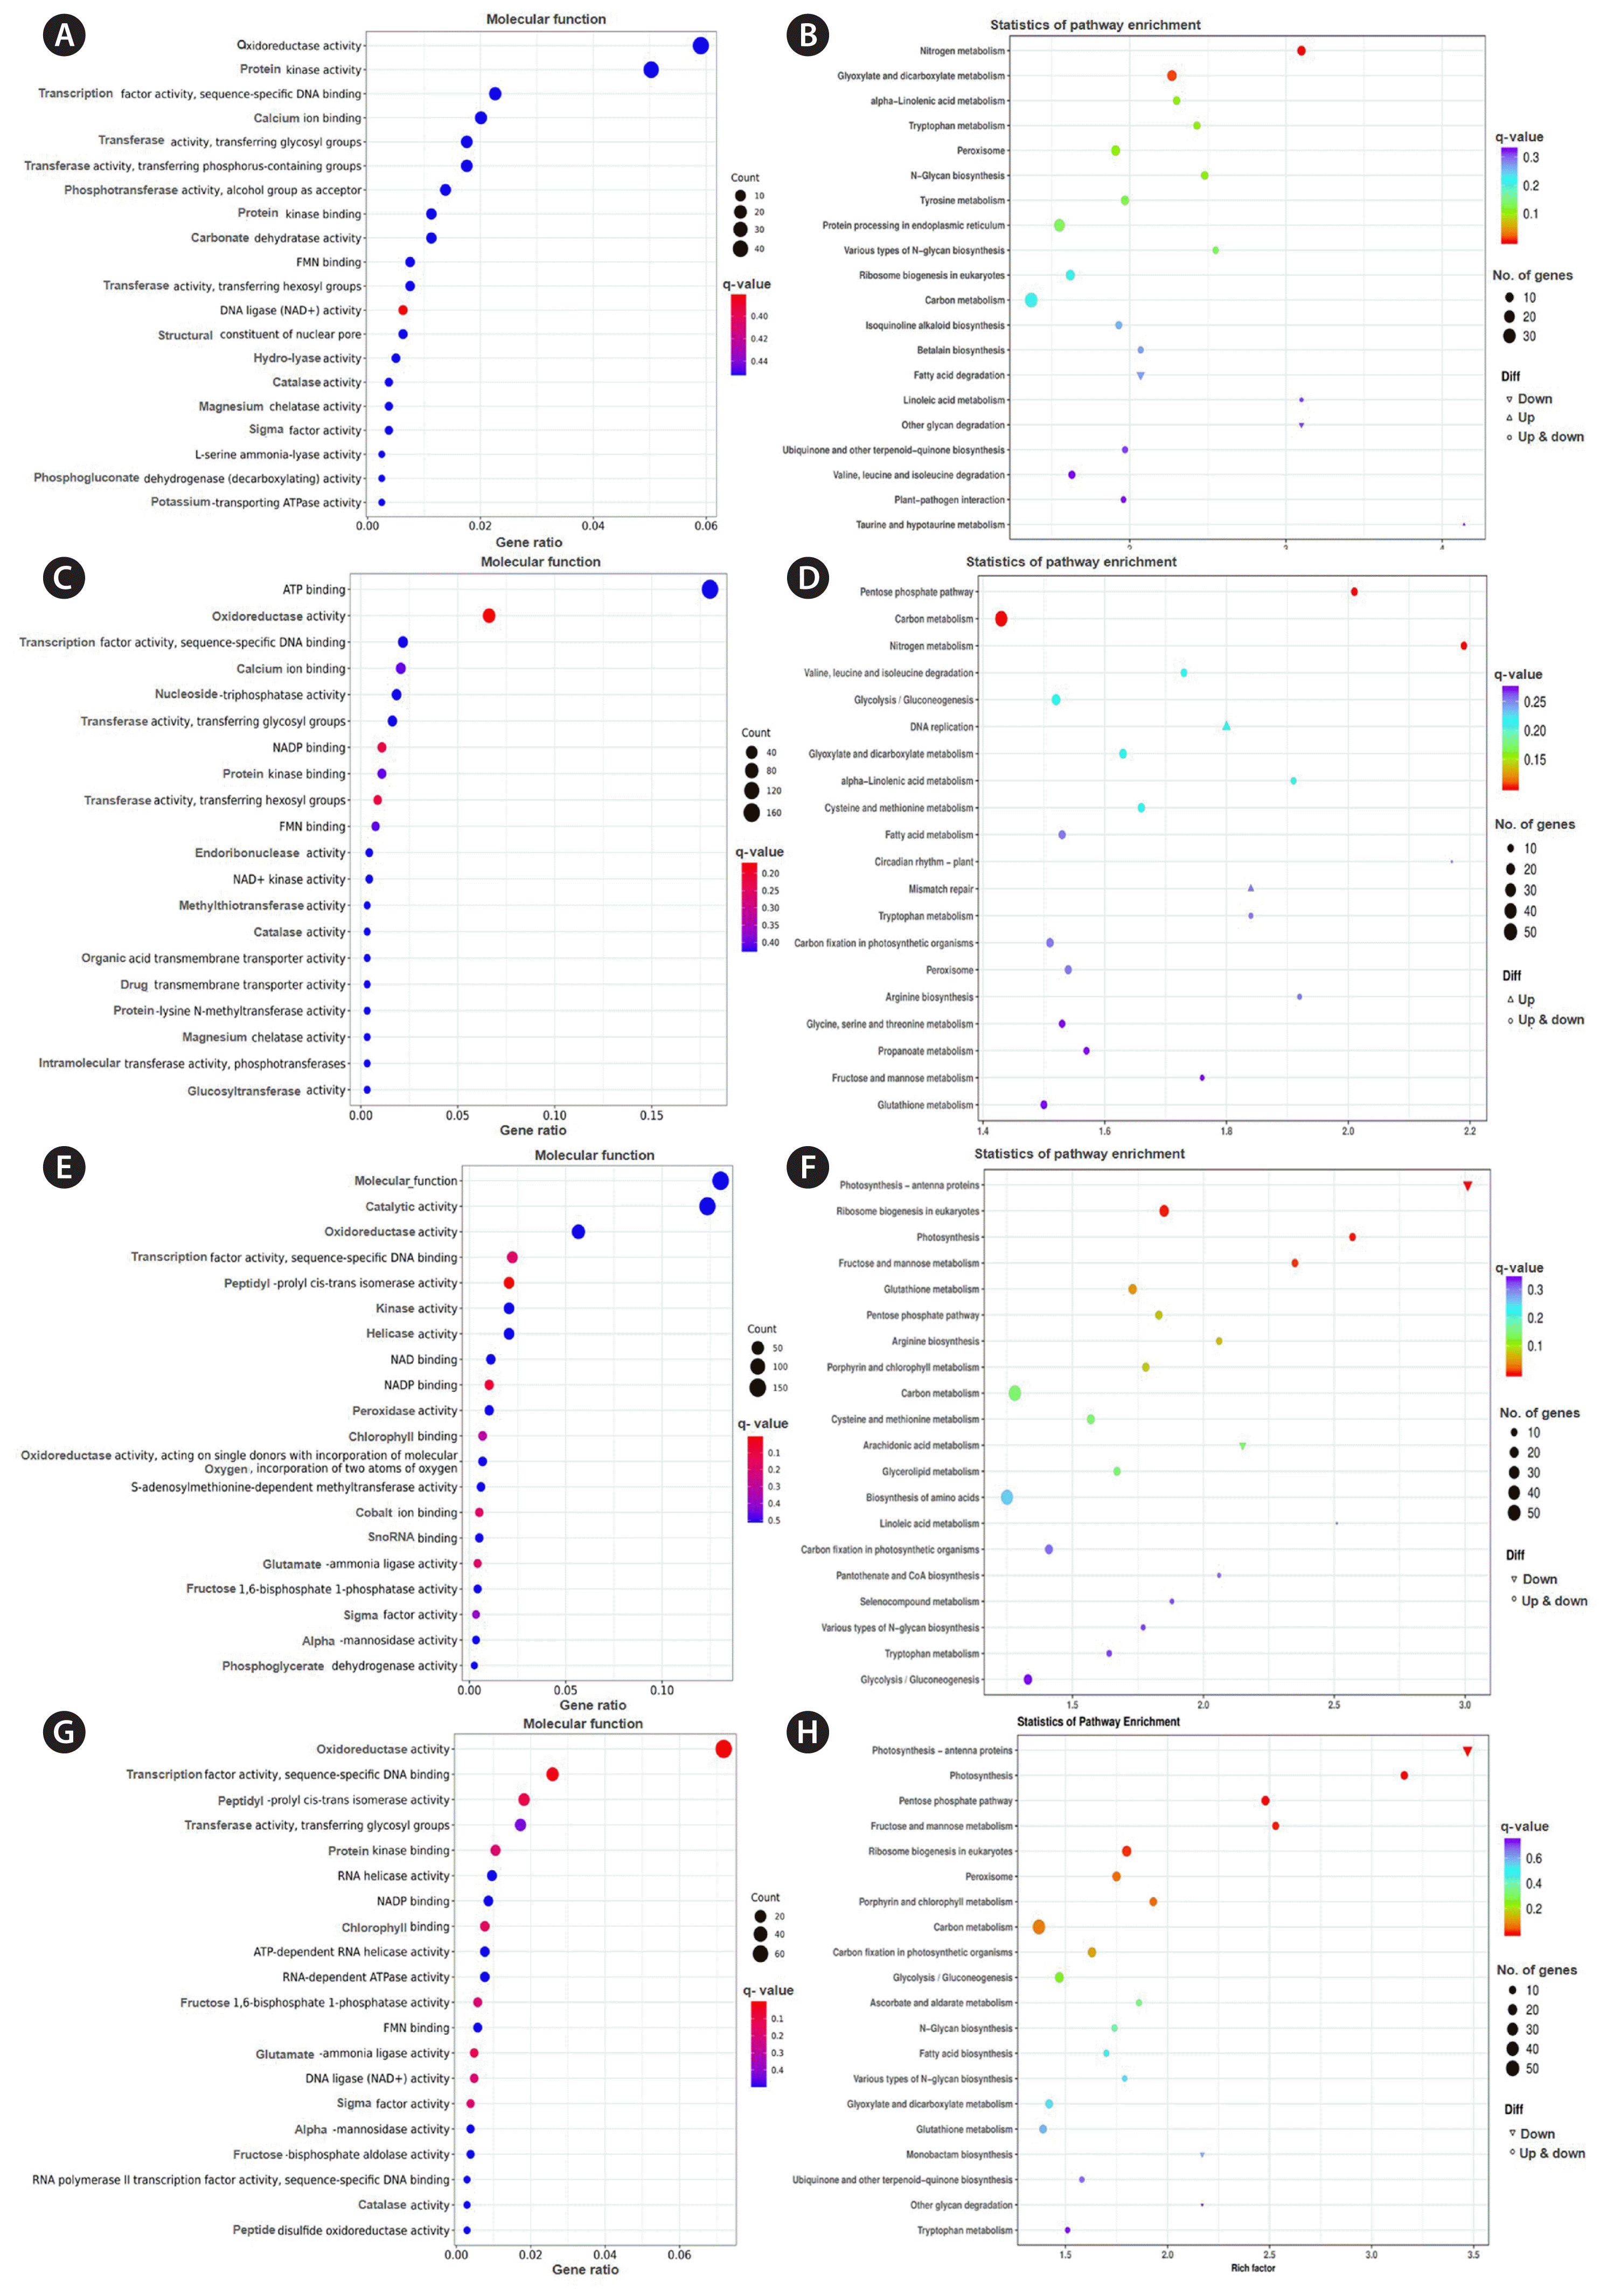
Gene Ontology functional (GO) analysis revealed that the DEGs between 2 and 0 h mainly related to functions of oxidoreductase activity, protein kinase activity, transcription factor activity and sequence-specific DNA binding, calcium ion binding, transferase activity, transferring glycosyl and phosphorus-containing groups (Fig. 5A). KEGG enrichment indicated that the metabolic pathways mainly enriched in metabolism of carbon, nitrogen, glyoxylate and dicarboxylate, α-linolenic acid and tyrosine metabolism, and also protein processing in endoplasmic reticulum (Fig. 5B).
DEGs of 6 vs. 0 h were mainly related to process of ATP binding, oxidoreductase activity, transcription factor activity and sequence-specific DNA binding, calcium ion binding, nucleoside-triphosphatase activity, transferase activity and transferring glycosyl groups, peptidyl-prolyl cis-trans isomerase and kinase and helicase activity (Fig. 5C). KEGG analyzed their pathways involved in carbon metabolism, pentose phosphate pathway, nitrogen metabolism, and glycolysis / gluconeogenesis (Fig. 5D).
DEGs between 24 and 0 h were mainly related to processes of molecular function, catalytic activity, oxidoreductase activity, transcription factor activity, and sequence-specific DNA binging (Fig. 5E). KEGG results showed the pathways mainly enriched in carbon metabolism, photosynthesis, ribosome biogenesis, fructose and mannose metabolism, and biosynthesis of amino acid (Fig. 5F).
GO analysis indicated DEGs between 48 and 0 h mainly related to oxidoreductase activity, transcription factor activity, sequence-specific DNA binding, peptidyl-prolyl cis-trans isomerase and transferase activity, and transferring glycosyl groups (Fig. 5G). Based on KEGG analysis, the pathways mainly enriched in carbon metabolism, photosynthesis, pentose phosphate pathway, ribosome biogenesis, fructose, and mannose metabolism (Fig. 5H).
DEGs related to photosynthesis
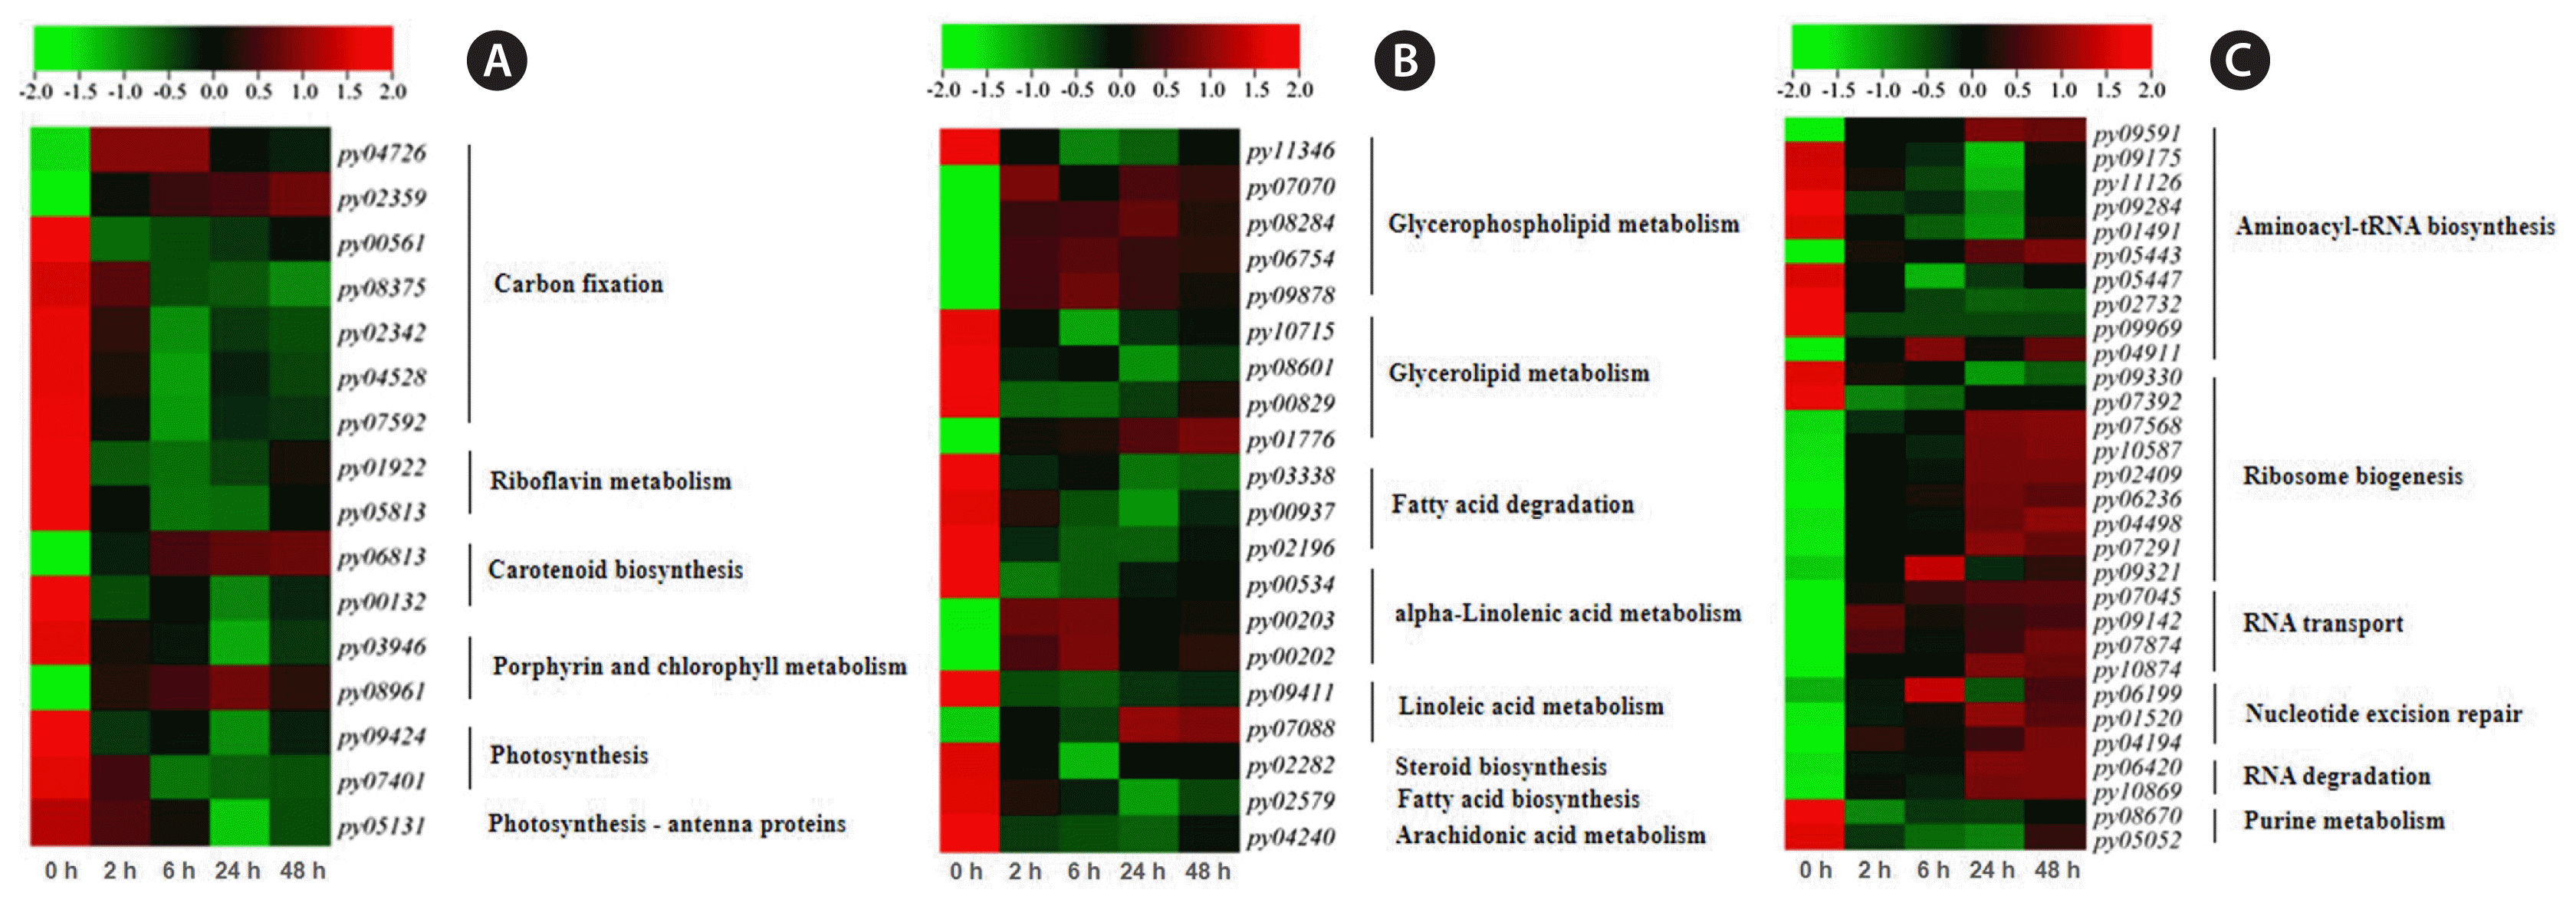
Based on Hierarchical Cluster analysis, it suggested that photosynthesis was generally down-regulated under cold stress (Fig. 6A). In five DEGs involved photosynthetic pigment genes, three of them (py00132, py03946, and py05131) significantly down-regulated (p < 0.05). Two DEGs (py01922 and py05813) related riboflavin (a coenzyme in electron-transfer reactions) metabolism significantly down-regulated, and so did the other two DEGs of photosynthesis (py09424 and py07401) even not so significantly. Accompanying with these, the DEGs related to Calvin cycle in carbon fixation also down-regulated excluding transketolase gene (py04726).
DEGs related to fatty acids metabolism
In P. yezoensis, under cold stress of 2°C, there were five DEGs involved in glycerophospholipid metabolism (py11346, py07070, py08284, py06754, and py09878), four DEGs in glycerol metabolism (py10715, py08601, py00829, and py01776), three DEGs in fatty acid degradation (py03338, py00937, and py02196), and six DEGs in unsaturated fatty acid metabolism (py00534, py00203, py00202, py09411, py07088, and py04240) (Fig. 6B). Most of these DEGs were down-regulated which involved in fatty acid degradation, but a few genes were up-regulated significantly (p < 0.01) at 6 and 24 h which involved in glycerophospholipid metabolism, α-linolenic acid metabolism, and linoleic acid metabolism.
DEGs related to ribosomes
Under cold stress, 10 DEGs were found that involved in aminoacyl-tRNA biosynthesis (py09591, py09175, py11126, py09284, py01491, py05443, py05447, py02732, py09969, and py04911), nine DEGs in ribosome biogenesis (py09330, py07392, py07568, py10587, py02409, py06236, py04498, py07291, and py09321), four DEGs in RNA transport (py07045, py09142, py07874, and py10874), three DEGs in nucleotide excision repair (py06199, py01520, and py04194), two DEGs in RNA degradation (py06420 and py10869), and two genes in purine metabolism (py08670 and py05052) (Fig. 6C). Most of these DEGs were up-regulated under 2°C stress, involving in ribosome biogenesis, RNA transport, nucleotide excision repair, and purine metabolism, and their expression levels gradually increased along with time.
Validation of gene expression
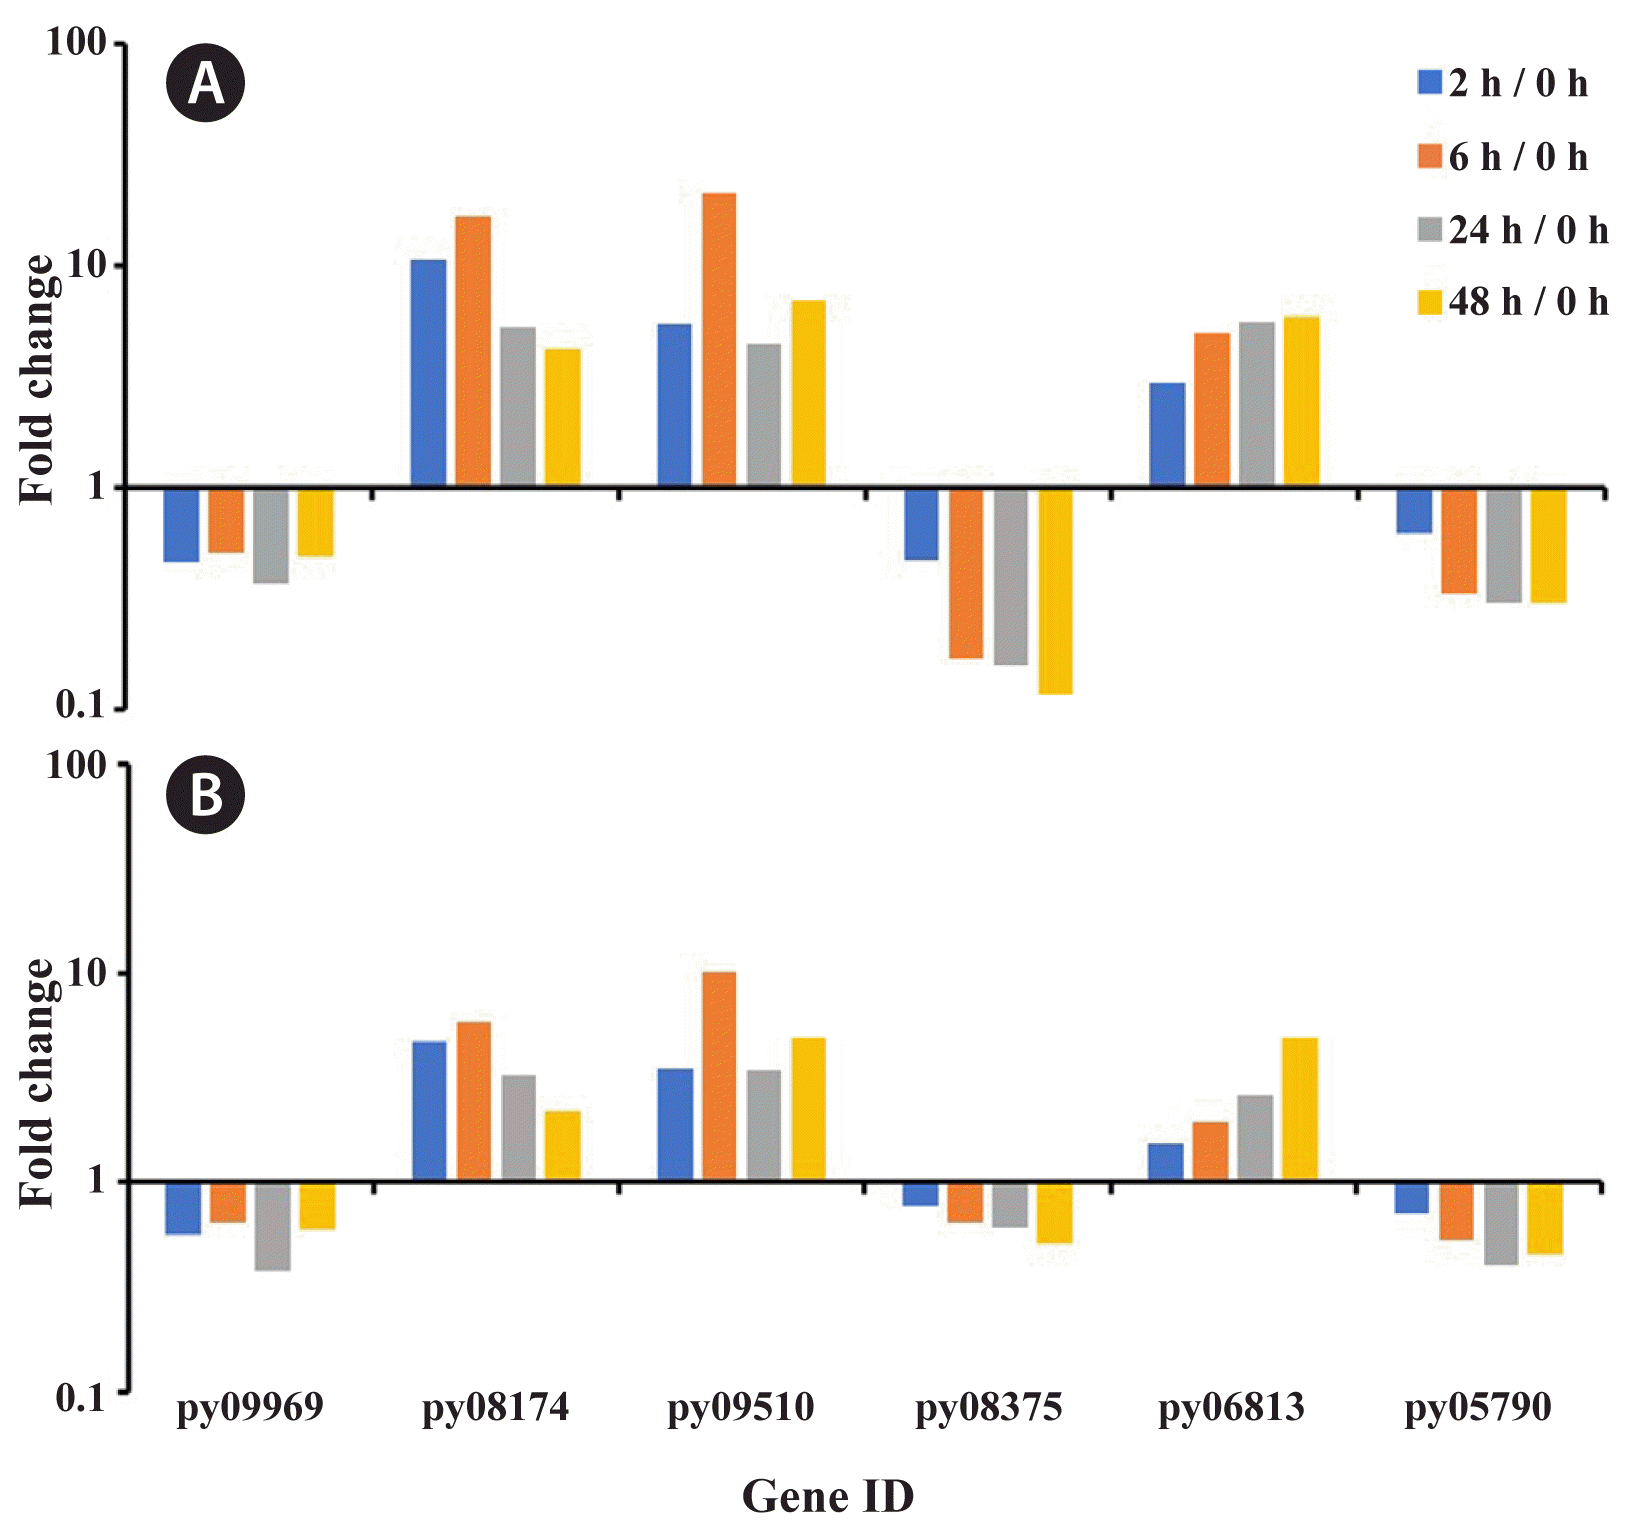
Compared with RNA-Seq data, RT-PCR results of six genes selected at random exhibited the expression with same trend, validating the expression profiles (Fig. 7). The gene-related tRNA synthetases class II core domain (py09969), phosphoglycerate kinase (py08375), and glyceraldehyde 3-phosphate dehydrogenase (py05790) were down-regulated expression along with the treatment time. The gene of catalase (py08174), glucose-6-phosphate dehydrogenase (py09510), and carotenoid oxygenase (py06813) were generally up-expressed comparing to initial time, although their variation trends were different along with the time.
Co-expression network analysis
The co-expression network analysis performed on all of the DEGs throughout the entire course of cold stress resulted in three network modules of blue, brown, and turquoise with 436, 73, and 557 genes, respectively (Fig. 8). Based on connection number, the top 15% of genes were selected as hub genes.
The turquoise module had higher positive correlation with 0 h initial time including genes significantly enriched in metabolic pathways of carbon metabolism, amino acid biosynthesis, glycolysis / gluconeogenesis, carbon fixation, and glyoxylate and dicarboxylate metabolism; in genetic information processing of protein processing in endoplasmic reticulum; in environmental information processing of ABC transporters; and in cellular processes of peroxisome (Fig. 9A & B). The hub genes of turquoise module were donated function as protein kinase, phosphoinositide phospholipase C (Ca2+-dependent) GDP-fucose protein O-fucosyltransferase, and carbonic anhydrase, which mainly participate in polysaccharide degradation and protein processing in the endoplasmic reticulum (Table 4).
The blue module had positive correlation with 24 and 48 h. The genes of blue module were significantly enriched in metabolic pathways of photosynthesis, carbon metabolism, glycerophospholipid metabolism, and amino acid biosynthesis; in genetic information processing of ribosome biogenesis; enriched in environmental information processing of ABC transporters; and in cellular processes of endocytosis (Fig. 9C & D). Its hub genes function as voltage-gated chloride channel, Zinc finger (C2H2 type), short chain dehydrogenase, ABC1 family and beta-lactamase superfamily domain, which mainly participate in signal transduction mechanisms, translation, ribosome structure and biogenesis, and secondary metabolite biosynthesis, transport, and catabolism (Table 4).
The brown module had a higher positive correlation with 6 h. The genes of brown module were significantly enriched in metabolic pathways of nitrogen metabolism, fatty acid metabolism, tyrosine metabolism, biosynthesis of unsaturated fatty acids and glyoxylate and dicarboxylate metabolism; enriched in genetic information processing of DNA replication; enriched in environmental information processing of ABC transporters; and enriched in organismal systems of circadian rhythm (Fig. 9E & F). Its hub genes were donated as ankyrin repeats, cupin, aldehyde dehydrogenase family, and FAD binding domain, which mainly involved in energy metabolism maintaining the normal structure and function of cell membranes (Table 4).
DISCUSSION
Physiological response in Pyropia yezoensis under cold stress
As cold-tolerant macroalgae, P. yezoensis thalli can grow well during period spans the winter (Sun et al. 2015, Watanabe et al. 2017). Cold acclimation of P. yezoensis also presented in this study when exposure to non-freezing (chilling) temperature of 2°C. During the early cold stress of 6 h, the photosynthesis of P. yezoensis decreased significantly indicated by parameters of Fv/Fm, ΦPSII, NPQ, and qP. Combining the reduction of open degree of PSII reaction center, the transport of photosynthetic electrons was decreased, and at the same time, the heat dissipation was depressed and excess light energy couldn’t be dissipated timely. All these resulted in the decline in photochemical efficiency and practical photochemical efficiency. However, from 6 to 24 h exposure time, there was an obvious increase for Fv/Fm (photosynthetic capacity) and NPQ (ability to avoid damage from excess light energy), indicating a recovery of photosynthetic ability during night time. It also showed that the snow microalga Chlamydomonas nivalis could maintain its photosynthetic activity and limit damage to the photosystem from excess light energy by reducing the light-harvesting ability of PSII and enhancing the cyclic electron transfer around photosystem I (Zheng et al. 2020).
Physiologically, the light energy utilization capacity of P. yezoensis also related to the photosynthetic pigment content, which directly affects the utilization efficiency. Phycobilisomes, as the primary light-harvesting pigment protein, is important for physiological activity in red macroalgae. On the other hand, Chl a as a pigment of the photosystem reaction centers, is vitally important for light energy conversion in photosynthesis. In the present study, after two days (48 h), pigment contents decreased in PE and APC (significantly). Even though it was insignificantly increased in PC and Chl a in this study, it significantly decreased after six days exposure to 2°C in our previous work (Xie et al. 2023), indicating the same trend of depression in photosynthesis of P. yezoensis under cold stress.
The photosynthetic characteristics of P. yezoensis were closely related to temperature, and so did the content of these photosynthetic pigments. This change related to photosynthesis, in turn greatly affected the growth rate of thalli (Zhang et al. 2014, Takahashi et al. 2020). In the present study, the average growth rate of P. yezoensis thalli was lower in the early cold stress of 2–6 h but increased significantly after. The rise of average growth rate after 6 h could be contributed to the accumulation of photosynthetic products during 6 to 24 h despite of the slight decrease in photosynthetic efficiency. The P. yezoensis exhibited an acclimation to the low-temperature in short time with less influence on its growth in long time.
Different expression gene patterns in Pyropia yezoensis under cold stress
Transcriptome analysis revealed that gene transcription changes along with the stress time. In the present study, the numbers of the total DEGs compared with initial time (0 h) increased from the lowest 2,134 at 2 h to the highest 2,881 at 24 h, and slightly decreased to 2,688 at 48 h. The DEGs associated with the basic bioprocess of carbon metabolism and photosynthesis always occupied the top position indicating continual effects from cold stress, and so did the oxidoreductase and transcription factors activity and sequence-specific DNA binding. Besides, there was certain conversion of some DEGs with different functions and respective process. For instance, the DEGs that function of calcium ion binding were enriched during the early stage of 2 and 6 h, the DEGs of catalytic activity increased at 24 h, and DEGs those involved ribosome biogenesis became active from 24 h along with biosynthesis of amino acids and protein translational modification. It indicated that the response of P. yezoensis to cold stress is a process of systemic acquitted acclimation (Mittler and Blumwald 2015, Szechyńska-Hebda et al. 2017).
Photosynthesis is a temperature-sensitive process for conversion of light into chemical energy. Exposure to low temperatures or constant light would cause an energy imbalance that leads to the production of reactive oxygen and then cell damage (Huner et al. 1998, Aslamarz and Vahdati 2010). To avoid these, several mechanisms were found involving in reduction of light-harvest capacity, such as depressing phycobilin production at the transcriptional level (Huner et al. 1998, Zheng et al. 2020). Therein, the oxidative damage caused by the imbalance of the electron transport system could be controlled to the maximum extent (Zheng et al. 2020). In this study, the content of phycobilin decreased under 2°C for 48 h, indicating that the production of phycobilin was inhibited. In studies of plants or green algae, the antioxidant system is usually enhanced to protect cells from oxidative toxic effects when subjected to low-temperature stress (Yadav 2010, Zhang et al. 2019). In P. yezoensis, we found catalase gene (py08174) up-expressed in the early stage of 2–6 h indicating the utilization of the antioxidant system. On the other hand, P. yezoensis might also adopt the strategy of inhibiting the photosynthetic system. For instance, there were down-regulated genes of phycobilin and PSII-psb subunit synthesis (py03946), and up-regulated genes of carotenoid oxygenase (py06813), and porphyrin and chlorophyll metabolism (py08961). Subsequently, down-regulation of the photosynthetic system could affect the Calvin cycle and carbon fixation. In this study, pathways such as carbohydrate, amino acid, and pyruvate metabolism were down-regulated, suggesting a decrease of basal metabolic activity, which may reduce energy loss in cells.
In the present study, the transcript analysis showed significant enrichment of fatty acid degradation and unsaturated fatty acid biosynthesis. Under low-temperature stress, several genes involved in fatty acid desaturation were up-regulated, including delta-12 and delta-9 fatty acid desaturase. The delta-12 can combine with ω3 desaturase to catalyze the formation of saturated fatty acids C18:2 and C18:3 from C18:0 (Tsai et al. 2019). The delta-9 fatty acid desaturase can catalyze C16:0 and C18:0 as substrates to form double bonds and produce C16:1 and C18:1 (Valledor et al. 2013). The desaturation of fatty acids is essential for maintaining cellular energy status and membrane fluidity which is related to cell function (Antikainen and Pihakaski 2010). An increase in the unsaturation of fatty acids will increase the membrane fluidity and decrease the low-temperature effect on transition from liquid crystal to gel phase (Zhang et al. 2019). There is a positive correlation between high levels of polyunsaturated fatty acids and the ability to adapt to low temperatures (Morgan-Kiss et al. 2006). In this study, the significant enrichment of fatty acid degradation and unsaturated fatty acid biosynthesis on transcription level suggested that P. yezoensis may take this strategy of increasing fatty acid desaturation to tolerance low-temperature environment. This is consistent with the results of Sun et al. (2015) that 10 genes encoding fatty acid desaturase were up-regulated under cold and freezing stress which would increase the level of unsaturated fatty acids in P. yezoensis cells and increase the fluidity of the membrane.
When exposed to cold stress, it is general for organisms to reduce energy-intensive processes in order to improve cell tolerance and survival. Hang et al. (2018) found in rice that low-temperature stress affected rRNA biogenesis during the pre-rRNA processing, resulting in the reduction of pre-rRNA production and ribosome assembly, therefore reducing energy consumption. However, in the present study, transcriptionally, most genes related to ribosome biogenesis were up-regulated in P. yezoensis. For instance, the expression of endonuclease and exonuclease genes involved in rRNA transcription, homologous protein genes involved in 90S pre-ribosome assembly and a large number of RBF genes required for 35S pre-rRNA splicing and assembly are all up-regulated. Their up-regulation undoubtedly would accelerate ribosome assembly. It was deduced that under low-temperature stress, P. yezoensis maintains high ribosome assembly activity for preparing of protein translation. It also found significant enrichment and up-regulation of the pathway “aminoacyl-TRNA bioproduction and protein processing in the endoplasmic reticulum,” which indicated accelerated protein synthesis. This mechanism may be due to the high acclimation of intertidal macroalgae to their varied and harsh environments. Under low temperature, the acceleration of protein synthesis may be necessary to repair the damage caused by cold stress and to synthesize specific low molecular weight proteins that improve plant cold resistance (Bae et al. 2003, Antikainen and Pihakaski 2010).


