Shift in benthic diatom community structure and salinity thresholds in a hypersaline environment of solar saltern, Korea
Article information
Abstract
The community dynamics of benthic diatoms in the hypersaline environment are investigated to advance our understanding how salinity impacts marine life. Diatoms were sampled in the two salterns encompassing salt Ponds, ditches, and seawater reservoirs (n = 11), along the salinity gradient (max = 324 psu), and nearby tidal flats (n = 2). The floral assemblages and distributions across sites and stations showed great variations, with a total of 169 identified taxa. First, not surprisingly, higher diversity of benthic diatoms was found at natural tidal flats than salterns. The saltern diatoms generally showed salinity dependent distributions with distinct spatial changes in species composition and dominant taxa. Biota-environment and principal component analysis confirmed that salinity, mud content, and total nitrogen were key factors influencing the overall benthic community structure. Some dominant species, e.g., Nitzschia scalpelliformis and Achnanthes sp. 1, showed salinity tolerance / preference. The number of diatom species at salinity of >100 psu reduced over half and no diatoms were found at maximum salinity of 324 psu. The highest salinity for the observed live diatoms was 205 psu, however, a simple regression indicated a theoretical salinity threshold of ~300 psu on the survival. Finally, the indicator species were identified along the salinity gradient in salterns as well as natural tidal flats. Overall, high species numbers, varying taxa, and euryhaline distributions of saltern diatoms collectively reflected a dynamic saltern ecosystem. The present study would provide backgrounds for biodiversity monitoring of ecologically important microalgal producers in some unique hypersaline environment, and elsewhere.
INTRODUCTION
Salinity is one of the most significant environmental factors impacting the structure of aquatic communities (Lercari and Defeo 2006, Lozupone and Knight 2007, Choi et al. 2010). A substantial portion of the planet is of saline water, including marine environments (30–40 psu), hot springs (>10.5 psu), and soda lakes (Merino et al. 2019). In particular, the extreme conditions of hypersaline environments serve as good models towards enhancing our understanding of both early stages of life on Earth and possibility of extraterrestrial life (Merino et al. 2019).
Microbial communities are predominated in such hypersaline environments; consequently, their ecology has attracted extensive scientific interests. Pedrós-Alió et al. (2000) reported that bacterivory and chlorophyll-a concentrations were maximal at salinity of ~100 psu and bacterivory disappeared above ~250 psu. Park et al. (2009) subsequently isolated two extremely halophilic flagellates from salt pools in Korea that had a salinity of >300 psu.
Many studies have investigated aquatic microorganisms inhabiting high-saline environments; yet, numerous questions remain on ecology of benthic diatoms. Diatoms are crucial primary producers and important food sources for many aquatic lives in marine environments (Park et al. 2014). They are also one of the most diverse groups of extremophiles, being documented in almost every aquatic environment. Such ubiquity of diatoms is primarily attributable to their capability of producing bio-silica cell walls (Round et al. 1990). Diatom assemblages also exhibit high resistance to various other environmental stresses, such as pH (Dickman et al. 1984), temperature (Krebs et al. 1987), and UV (De Tommasi et al. 2018). Thus, their tolerance to poly-extreme environments means that they are anticipated to adapt to prospective environmental changes.
The earliest studies of diatoms in hypersaline environments mainly focused on describing new taxa (John 1991) and implementing culture-based experiments (Clavero et al. 2000, Yamamoto et al. 2017). Later, some studies have examined the structure of diatom communities in hypersaline environments, including tidal lagoon (De Lomas et al. 2005) and lake and stream (Taukulis and John 2006). However, these studies are limited to examine specific salinity ranges and generally lacked in evidence of living diatoms in the given environments. Of note, simple detection and measurements of chloroplasts do not provide exact measures of diatom biomass. Furthermore, even the detection of frustules in samples does not mean that the diatom species were actually live, as their frustules tend to remain for up to several ten years (Sawai 2001).
While the diatom assemblages of various hypersaline environments have been explored, the solar salterns have been overlooked. Salterns are typically installed in coastal areas for salt production, which create a wide variety of artificial saline environments with increasing salt concentration from natural seawater to salt ponds. Thus, seawater is the initial source of sea salts in the salterns. As seawater evaporates in a series of salt ponds, saltern provides artificial salinity gradient (from brackish to >300 psu), within a short walking distance (<1 km). Although the densely developed biofilms of benthic diatoms are often found in solar salterns, the spatiotemporal dynamics linked to their survivals remain in question.
The present study aimed to investigate salterns to delineate the dynamics of benthic diatoms along the salinity gradient, particularly encompassing high salinity, up to >300 psu. The specific objectives were to (1) understand the structure of benthic diatom assemblages at saltern environments across a wide range of salinity; (2) address the preference and / or tolerance of diatom species to different levels of salinity; and (3) identify indicator species for specific salinity ranges for use as ecosystem response predictors in hypersaline environments.
MATERIALS AND METHODS
Study area
Salt production in solar salterns is based on consecutive concentrations of NaCl, along a series of shallow ponds where most water evaporates. In the final process, pure salt crystallizes out of the saturated brine solution. Therefore, the salinity of seawater in a saltern increases stepwise toward the end of the series of ponds.
The present study includes two datasets for investigation of the Korean saltern diatoms in 2005 (dataset I) and 2020 (dataset II). The first target saltern was surveyed at Muan (site A; n = 6) and the second survey was carried out at Sinan (site B; n = 7) (Fig. 1). Of note, it is unfortunate in that the access to Muan saltern was denied in 2020, thus temporal aspect could not be examined at present. The studied area is a major region for producing sea salt productions in Korea and the nearby marine environment generally represents the typical tidal flat system in the west coast of Korea. A considerable area of the former natural tidal flats has been reclaimed along the west coast to create artificial salterns as well as agricultural lands. The area of salterns in Muan and Sinan collectively reaches ~27 km2 as of 2017.
Map showing the study area with an overview of sampling design in the two salterns. (A) Site A in Muan and site B in Sinan. (B) Salinity increased from station A1 to A5 (site A) and from station B1 to B6 (site B). AR and BR located in the adjacent natural tidal flats refer to the reference stations at both sites. (C) Site view showing the general landscapes across the sampling stations encompassing five habitat types (viz., tidal flat, seawater reservoir, small ditch, large ditch, and salt pond) in the two salterns.
Sampling and laboratory analyses
A total of thirteen stations from two salterns were surveyed in Muan (site A) and Sinan (site B) in the present study (Fig. 1). The sampling was designed to encompass a wide range of salinity up to the highest measurable salinity of 324 psu (at site A). Of note, samples were collected from the adjacent tidal flats, viz., outside of the salterns which were considered to be the reference sites as well as the potential sources of diatoms to the salterns (Fig. 1A). For the details on each sampling point, refer to the notes provided in Supplementary Table S1.
In brief, a saltern in Muan containing 61 salt pans with a wide salinity range of 32–324 psu was first investigated in 2005 (Fig. 1B). Samples were collected from five stations (A1–A5) including seawater reservoir and ditches in a saltern and one from outside tidal flat (AR). The top 0.5 cm of surface sediment was collected for the analysis of diatom assemblages. Light microscope (BX53; Olympus, Tokyo, Japan) and scanning electron microscope (MIRA3; Tescan, Seoul, Korea) were used to obtain photographic documentation of diatoms and / or to perform species identification. Diatoms were identified to the species level when possible. Microscopic photographs of the dominant species found in this study were presented in Supplementary Fig. S1.
In 2020, the other saltern in Sinan, with 38 salt pans and salinity range of 31–205 psu, has been investigated (Fig. 1B). Six stations (B1–B6) encompassing seawater reservoir, ditches, and salt ponds were surveyed. Samples were also collected from the nearby tidal flat (BR) as reference site. The environmental parameters potentially impacting diatom assemblages were extensively examined at this time to better understand the environmental conditions linked to the benthic diatom community structure. In this regard, more elaborated sampling efforts are given to measure and analyze several environmental parameters in situ and in the laboratory.
First, surface sediments (<3 cm) were sampled to analyze general sediment properties such as water content, mud content (MC), and total organic content. In addition, sediment chlorophylls were measured as a proxy for the biomass of benthic diatoms. Second, stable isotope ratios of carbon (δ13C) and nitrogen (δ15N) were measured for sediment, particulate organic matter, and diatoms. Stable isotopes were measured using an Elemental Analyzer-Isotope Ratio Mass Spectrometer (EA-IRMS; Elementar, GmbH, Hanau, Germany). Third, seawater parameters were measured in situ using multi-parameter water quality probe (YSI-Professional Plus; Ohio, OH, USA). They included temperature (°C), dissolved oxygen (DO; mg L−1), salinity (psu), and pH. The concentrations of nutrients including total nitrogen (TN; mg L−1), PO4-P (mg L−1), and SiO2 (mg L−1) from filtered seawaters were also measured, using an auto nutrient analyzer (QuAAtro39; Seal Analytical, Norderstedt, Germany), in the laboratory.
Data analyses
The relative abundance of each taxon was calculated through counting diatom valves (ca. 500 valves per station for site A and ca. 300 per station for site B) under the light microscope. Cluster analysis (CA) and non-metric multidimensional scaling were then carried out on the resulting matrix. Species with less than 1% of total abundance to diatom assemblages in the two salterns were excluded from the analyses. Bray-Curtis similarity coefficients were calculated, and the data were subjected to group average sorting. Abundance was fourth root-transformed to balance it across the recorded taxa for measures of similarity. The analysis of similarities (ANOSIM) test was performed to confirm that these groups differed significantly. Similarity percentages (SIMPER) analysis was performed to identify the taxa responsible for differences between groups. Biota-environment (BIOENV) procedure was used to determine the factors determining the structure of diatom assemblages.
Permutational multivariate analysis of variance (PERMANOVA) was performed to assess the significance of variables across sites and salinities, in terms of species diversity and composition of benthic diatoms. PRIMER 6 statistical software was used to perform all analyses (Clarke and Gorley 2006).
Indicator value (IndVal) analysis (Dufrêne and Legendre 1997) was performed to identify indicator diatom species for specific ranges in the salinity groups: brackish (<30 psu), saline (30–40 psu), hypersaline I (40–80 psu), and hypersaline II (>100 psu).
The IndVal index was calculated using Eq. (1):
, where Aij is specificity (i.e., proportion of individuals of species i in class j) and Bij is fidelity (i.e., proportion of sites in class j that included species i). The maximum value (max = 100%) provided by the IndVal procedure indicates a perfect indicator when all specimens of a species are found in a single group of samples and when the species occurs in all samples of that group. For each species, the highest value was considered as the indicator value. The indicator value was calculated as follows, using Eq. (2):
The index was maximal (max = 1) when individuals of species i were detected at all sites belonging to a single group. IndVal analysis, principal component analysis (PCA), and a Pearson correlation analysis were performed using R Studio version 1.0.153 software (http://www.rstudio.com).
RESULTS
Environmental settings
Fourteen environmental parameters for general qualities of seawater and sediments were measured in the study area (Table 1). The reference station of AR surveyed in 2005 showed the lowest salinity (24 psu), which is lower than the typical salinity range of the Yellow Sea (30–33 psu). This is because of a freshwater influence from a small upper creek in site A. Another reference station of BR surveyed in 2020 had relatively high salinity (~34 psu), similar to the normal seawater salinity. Salinity showed a clear gradient from the seawater reservoir to the end of the saltern at both surveyed salterns of site A (24–324 psu) and B (31–205 psu) (Table 1, Fig. 1). Of note, MC (%) in BR differed from those in the other sampling stations (B1–B6) situated within the saltern. Presumably finer sediments are more easily resuspended and transferred to the reservoir during the seawater intake (Fig. 1C).
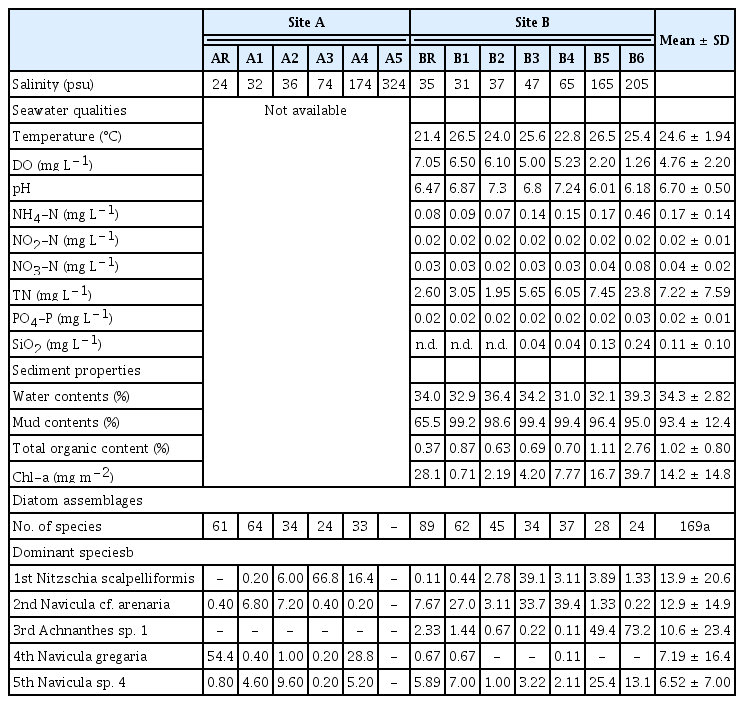
Overview of data on the environmental variables and benthic diatom community structure in the two salterns, site A (Muan) and site B (Sinan)
DO was lower when salinity was higher. At a series of salt ponds with high salinity range of 165–205 psu, hypoxic conditions (1.26–2.20 mg O2 L−1) were evidenced. As seawater evaporated and concentrated along the series of ponds, nutrient concentrations tended to increase (except NO2-N). It should be also noteworthy that sediment chlorophylls tended to keep increasing towards higher salinities, indicating potential contribution of bacterial biomass (or production) in addition to the benthic diatoms at the saltern. In anyhow, environmental data measured in the present study broadly supported dynamic abiotic conditions at hypersaline environments (Table 1).
Distribution of benthic diatom assemblages
A total of 169 diatom taxa were identified across the 13 sampling stations in the present study. Viability of diatom assemblages was also confirmed with observation of live diatom cells. A total of 104 species were documented (mean = 43) at site A, and 132 species (mean = 45) at site B. List of all diatom species found and identified in the two salterns with relative abundance data is provided in Supplementary Table S2.
Species diversity and evenness decreased with increase of salinity (Fig. 2A, Supplementary Table S3). The highest number of diatom species was recorded at BR (89 species), and the lowest diversity of species was observed at stations A3 and B6 (both 24 species). No diatoms were found at station A5, at which salinity was recorded highest (324 psu). Decreasing species evenness indicated that few species dominated the hypersaline environments. Diatom assemblages in water with higher salinity had the larger disparity in abundance within each species. For example, Nitzschia scalpelliformis had 66.8% of total abundance at station A3, while Achnanthes sp. 1 had 73.2% abundance at station B6.
Overview of benthic diatom communities under a wide range of salinities in the two salterns of sites A and B. (A) Number of occurred species and diversity indices along the salinity gradients in the two salterns. No diatom was detected at station A5. (B) Cluster analysis based on the relative abundance of diatom species with four categorized groups by specific range of salinities; brackish, seawater and hypersaline conditions. (C) Relative abundance of the top six dominant diatoms species (>5% of total abundance) belonging to each group are given.
N. scalpelliformis was the most dominant species, representing 13.9% of all counted individuals. The next most dominant diatom species were Navicula cf. arenaria (12.9%), Achnanthes sp. 1 (10.6%), Navicula gregaria (7.19%), and Navicula sp. 4 (6.52%) in order. In general, diatom assemblages varied considerably with respect to site- and station- (primarily salinity) specific distributions. As a site-specific example, Achnanthes sp. 1 was the most abundant species at site B (fourth most abundant species in the total study area); however, no individuals were found at site A. Regarding the salinity gradient, Achnanthes sp. 1 showed the lowest abundance at a salinity of <65 psu; however, its abundance sharply increased in the last part of the series of ponds (>165 psu) at site B.
CA was used to delineate station groups with similar species compositions of diatoms (Fig. 2B). Four representative groups (groups A1, A2, B1, and B2) were detected across the 13 stations of the two sites (ANOSIM: R = 0.77, p < 0.05). These clusters showed clear differences between sites and further by salinity in each station.
First, stations of AR and A1 having salinity of <35 psu at site A were separated into one representative group, group A1, with 42.4% similarity. The species that contributed most to dissimilarities with other groups was Paralia sulcata (5.63%). Group A2 encompassed three stations (A2–A4), which were characterized by a hypersaline environment (>74 psu, mean salinity = 191 psu) at site A. This group showed a noticeable peak in relative abundance for certain dominant species, N. scalpelliformis (29.7%). SIMPER analysis showed that this species was the most potent contributor to the dissimilarity of group A2 to other groups.
Group B1 encompassed five stations (BR and B1–B4) with salinity of <70 psu. N. cf. arenaria, N. scalpelliformis, and P. sulcata dominated the group. Interestingly, N. cf. arenaria and N. scalpelliformis were more abundant at higher salinities, whereas the abundance of P. sulcata declined with increasing salinity. The dissimilarity of group B2 to other groups was mainly caused by N. cf. arenaria (9.71%). Finally, group B2 encompassed stations B5 and B6, with salinities of >70 psu. This group was characterized by the lowest species diversity and evenness. The species that contributed most to the dissimilarities with other groups were Achnanthes sp. 1 (15.6%) and Navicula sp. 4 (11.2%), respectively.
DISCUSSION
Distribution of diatoms along the environmental gradients
BIOENV analysis showed that salinity was the best matched single factor for the species composition and diversity (Table 2). Species composition had the strongest correlation with salinity, MC, pH, and TN. Species diversity showed the strongest correlation with salinity and MC. The dominant species were associated with the four environmental factors, i.e., salinity, MC, pH, and TN, identified by BIOENV analysis (Fig. 3). Overall, the ranges of all species in occurrence across salinity, MC, pH, and TN reflected their parameter-specific distribution preferences in the study area. For example, half of the species occurred from normal seawater to the moderately hypersaline environments (36–65 psu). However, most dominant species occurred across a wider range of salinity, even at salinities >100 and 200 psu, though at relatively low frequencies. The most dominant species were assumed to have wide salinity tolerance ranges; in contrast, Navicula cf. pavillardii was primarily detected in seawater salinity ranges.

Results of BIOENV analysis showing the strongest correlations for single or combined environmental variables that best matched the species diversity (viz., relative abundance) and species composition of benthic diatoms at the solar saltern (site B)
Boxplots for occurrence (viz., presence or absence) of the seven selected species (Napa, Navicula cf. pavillardii; Cyli, Cyclotella litoralis; Naar, Navicula cf. arenaria; Nav4, Navicula sp. 4; Nisc, Nitzschia scalpelliformis; Ach1, Achnanthes sp. 1; Nav1, Navicula sp. 1) with respect to salinity, mud content (MC), pH, and total nitrogen (TN) based on dataset II (site B). The benthic diatom species with a >1% of relative abundance was presented. The blue shading represents the occurrence ranges of all species in the study area. Seven species were arranged in ascending order of median values in their occurrences with respect to salinity gradient.
Interestingly, diatoms occupied distinct ranges in relation to MC. While most of the dominant species (except N. cf. pavillardii) occurred in a very narrow range of MC (95.0–99.4%), half of all species occurred over a much wider range of MC (65.5–99.2%). This phenomenon may be attributable to large differences in the MC between the reference station (BR, 65.5%) and stations in saltern (B1–B6, 95.0–99.4%). Compared to the saltern, the reference station was characterized by low MC and higher species numbers. It should be noted, however, that various species detected in the reference station would have been filtered out in the drawing process of seawater to the salterns. pH and TN had negligible impacts on the distributions of dominant diatom species. However, Navicula sp.1 and Achnanthes sp. 1 appeared to preferentially occupy environments with relatively low pH and high nutrients.
Environmental factors controlling saltern diatoms
To elucidate the relationship between various environmental parameters and diatoms, BIOENV and PCA were performed on dataset II (site B). PCA of diatom assemblages and environmental variables confirmed the key factors influencing the occurrence and distributions of benthic diatoms in the saltern (Fig. 4A). PCA generated two major components that collectively accounted for 81.2% of total variance.
Relationship between benthic diatoms and environmental parameters based on dataset II (site B). (A) Principal component analysis of 7 selected species (Napa, Navicula cf. pavillardii; Cyli, Cyclotella litoralis; Naar, Navicula cf. arenaria; Nav4, Navicula sp. 4; Nisc, Nitzschia scalpelliformis; Ach1, Achnanthes sp. 1; Nav1, Navicula sp. 1) and environmental variables. (B) Correlation analysis between salinity and benthic diatom community structure, in terms of species numbers and diversity, scatterplot shown for two categorized ranges of salinity, viz., <100 psu and >100 psu, for a comparison.
The first axis was mainly explained by salinity, TN, and DO (explaining 56.9% of total variance), which are all related to the serial evaporation in the process of salt production. The most noticeable seawater parameter was salinity which seemed to directly influence species diversity of saltern diatoms. At the same time, salinity was found to be a key factor determining the distributions of selected taxa, as indicated by elevated occurrence of certain halophile species across specific range of salinity. At extreme salinity condition (station A5: 324 psu), the entire loss of diatoms was evidenced. Overall, a stepwise decrease in species diversity with increasing salinity (Fig. 2A) and occurrence of dominant species in relation to the salinity gradient (Fig. 3) clearly explained the key role of “salinity” in dynamics of saltern diatoms.
The second axis (PC2) could be explained by sediment properties, primarily mud content. Most sediments in the saltern were composed of fine-grained particles; however, relatively low MC in sediment was the main feature of the tidal flat at site B (reference station of BR). Coarse sediment particles settle quickly during the irrigation of seawater, accordingly sediment inside the saltern tended to consist of fine muds. Such environments would favor for the dominance of epipelic diatoms over epipsammic ones.
PERMANOVA showed that the composition of diatom species varied with both salinity and the reference stations as the initial source of diatom species to the saltern (Supplementary Table S4). First, the number of diatom species significantly differed between the two sites (df = 1, Pseudo-F = 4.45, p < 0.001) and across the salinity range (df = 3, Pseudo-F = 2.96, p < 0.001). Second, the composition of diatom species significantly differed between the two sites (df = 1, Pseudo-F = 4.57, p < 0.001), across the salinity range (df = 3, Pseudo-F = 3.21, p < 0.001) and between site and salinity (df = 2, Pseudo-F = 2.65, p < 0.001). Thus, the composition of diatom species surviving under high salinity conditions might vary depending on the composition of diatom assemblages initially introduced to the salterns.
A significant linear relationship was detected between salinity and species diversity in the two salterns (Fig. 4B). A simple linear regression between salinity and species numbers (or diversity) indicates a theoretical threshold of ~300 psu. Interestingly, however, the number of species and diversity index seemed to more rapidly decrease in the lower salinities (<100 psu) compared to those in the higher salinities (>150 psu). This phenomenon might reflect increasing salinity tolerance towards hypersaline environments (Fig. 4B), which should be further worthy to examine in aspect of biological mechanism. The complexity of community structure and functioning of microorganisms decays with increasing salinity stress (Pedrós-Alió et al. 2000). Of note, some previous studies demonstrated that high salinity has direct / indirect effects on the survival of diatoms (Clavero et al. 2000, Yamamoto et al. 2017).
Further, in order to investigate the salinity thresholds on marine lives, a mini-review was provided (Table 3). Both in situ and laboratory culture data are included. The diverse marine taxa were found to inhabit various hypersaline environments, encompassing solar saltern, dryland, and saline lake. The salinity thresholds greatly varied by the reported taxa, with maximum 360 psu from saline lake for a copepod species, Cletocampus retrogressus (Anufriieva 2014). For diatoms, Amphiprora paludosa and Amphora sp. were reported from the maximum salinity of 213 psu from a solar saltern in Long Island, Bahamas (Davis 1978). Unidentified diatoms were also reported at 200 psu from a microbial food web study that conducted in two salterns on the Mediterranean coast of the Iberian Peninsula (Pedrós-Alió et al. 2000). It should be noted that viability of diatom cells has not been evidenced in the above two literatures. Whilst, we observed 3 live benthic diatoms under light microscope, at salinity of 205 psu in Sinan (station B6); Amphora sp., Navicula sp. 1, and N. scalpelliformis. In fact, a total of 24 benthic diatom species, including above three live diatoms, were identified at the very station, which strongly supported the high diversity of benthic diatoms in Korean solar saltern, compared to others. We listed 9 species, which showed >1% of relative abundance to total (except for Amphora sp.), in the mini-review table at present (Table 3).
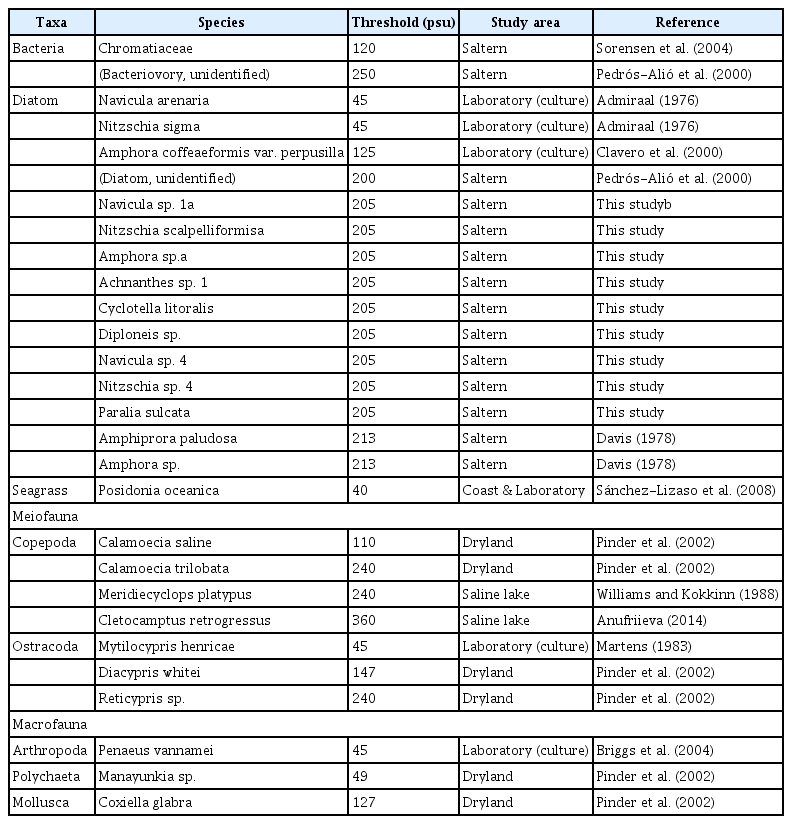
Mini-review on the salinity thresholds reported for various marine organisms in the hypersaline environments
Indicator species at hypersaline environments
Salinity was the most critical environmental factor that governed the occurrence and distributions of diatom species at A and B sites (Table 2). The sampling stations of the salterns in the present study had distinctive salinity gradients, and were grouped as: brackish (<30 psu), seawater (30–40 psu), hypersaline I (40–100 psu), and hypersaline II (>100 psu). IndVal identified indicator species corresponding to the four groups along the salinity gradient (Fig. 5, Supplementary Table S5).

Overview of salinity settings and schematic diagrams in benthic community structure at solar saltern environment in aspect of diversity, species composition (relative abundance of 4 indicator species and others illustrated), and euryhaline distributions of 4 selected species. Four selected indicator species include Navicula cf. pavillardii, Cyclotella litoralis, Nitzschia scalpelliformis, and Achnanthes sp. 1.
Seven indicator species were identified for each salinity range group (IndVal > 0.5, p < 0.05) (Supplementary Table S5). N. cf. pavillardii (IndVal = 0.81) and Navicula cf. salinarum (IndVal = 0.80) were the indicator species of the Brackish group. N. cf. pavillardii was present at the reference station in site A (AR), whereas few frustules were detected from the inside of the saltern. Navicula pavillardii is a cosmopolitan species that is closely related to N. cf. pavillardii in terms of taxonomic and ecological features. The species inhabit the sandy sediments of marine coasts (Witkowski et al. 2000) and has also been reported to frequently occur in brackish areas (Costa-Böddeker et al. 2017). Cyclotella litoralis (IndVal = 0.56) was identified as a seawater indicator species. It dominates the tidal flats of Sinan, where the present study sites were located (Lee 2013). It is also often recorded as a member of marine planktons along with Cyclotella meneghiniana and Cyclotella striata.
Rhopalodia sp. 3 (IndVal = 0.86) and N. scalpelliformis (IndVal = 0.83) were identified as indicator species for the hypersaline I (40–100 psu) group. Rhopalodia sp. 3 had a high indicator value, due to its strong preference for the higher salinities, despite representing only 1.01% of total abundance. In comparison, the relative abundance of N. scalpelliformis was 66.8% and 34.6% in the hypersaline I group of sites A and B, respectively. The relatively low dominance ratio found at site B was attributable to N. cf. arenaria dominating the hypersaline I group at site B, with 36.6% relative abundance. N. cf. arenaria had an indicator value of 0.59, dominating both the hypersaline environment and seawater, with 28.6% relative abundance (Supplementary Table S2). Altogether, there seemed to be a highly salt tolerant species which are able to endure seawater to hypersaline environments, rather than occupying specific hypersaline environments. In comparison, Rhopalodia sp. 3 and N. scalpelliformis preferentially inhabited hypersaline environments, or were the stronger competitors in the given environment.
Finally, Achnanthes sp. 1 (IndVal = 0.65) and Navicula sp. 4 (IndVal = 0.64) were identified as the indicator species of the hypersaline II (>100 psu) group. Achnanthes sp. 1 dominated station B6 (73.2%), but was not identified as a significant indicator species because species of this genus were not detected in site A. Thus, Achnanthes sp. 1 could not have been supplied by the tidal flat in site A (AR), as the initial species pool. Navicula sp. 4 dominated environments with salinity of >100 psu in sites A and B (except station A5 where no diatoms were observed).
In conclusion, the present study first reports the benthic diatom community shift in solar salterns along the artificial salinity gradients in situ. Living diatoms were observed at 205 psu salinity, which is considerably extreme condition. However, no benthic diatoms were detected at 324 psu. Salinity, MC, and TN were identified as significant environmental factors controlling the occurrence of benthic diatoms at solar saltern. The diatom assemblages exhibited distinct patterns along the salinity gradient, likely due to taxa-specific tolerance and / or preferences. Fewer species exhibited tolerance at higher salinities. Consequently, the species diversity of diatom assemblages declined with increasing salinity stress. Furthermore, a specific range of salinity gradients corresponded to the presence of certain indicator species. In conclusion, the saltern ecosystem provides a good model habitat to understand how marine benthic community responds and shifts in the hypersaline environments.
SUPPLEMENTARY MATERIALS
Supplementary Table S1. Information of sampling areas and environmental data in the two salterns (https://www.e-algae.org).
Supplementary Table S2. Relative abundance (%) of benthic diatoms found in the two salterns (https://www.e-algae.org).
Supplementary Table S3. Summary data for benthic diatom community structures in the two salterns (https://www.e-algae.org).
Supplementary Table S4. Result of PERMANOVA showing the significance of variables across study area and salinity in species diversity and composition at two solar salterns (https://www.e-algae.org).
Supplementary Table S5. Result of IndVal analysis listing the indicator diatom species by salinity group (https://www.e-algae.org).
Supplementary Fig. S1. Light microscope photographs of dominant benthic diatoms in the two salterns, salinity (psu) of the station where each species was most abundant given in parenthesis. (A) Cyclotella litoralis (31). (B) Paralia sulcata (31). (C) Navicula cf. salinarum (24). (D) Navicula sp. 1 (174). (E) Nitzschia cf. sigma (37). (F) Navicula gregaria (24). (G) Navicula sp. 4 (165). (H) Navicula cf. erifuga (31). (I) Navicula cf. arenaria (65). (J) Nitzschia scalpelliformis (74). (K) Seminavis sp. 4 (36). (L) Amphora cf. boliviana (174). (M) Rhopalodia rumrichiae (32). (N) Navicula cf. pavillardii (24). (O) Achnanthes sp. 1 (205) (https://www.e-algae.org).
ACKNOWLEDGEMENTS
This work was supported by the projects entitled “Ecosystem-Based Analysis and Decision-Making Support System Development for Marine Spatial Planning [grant number 20170325]” funded by the Ministry of Oceans and Fisheries of Korea (MOF), South Korea granted to Jong Seong Khim.