Growth and nutrient bioextraction of Gracilaria chorda, G. vermiculophylla, Ulva prolifera, and U. compressa under hypo- and hyper-osmotic conditions
Article information
Abstract
The present study was to determine the effects of salinity on the growth and nutrient bioextraction abilities of Gracilaria and Ulva species, and to determine if these seaweeds can be used for nutrient bioextraction under hypo- and / or hyperosmotic conditions. Two Gracilaria species, G. chorda and G. vermiculophylla, and two Ulva species, U. prolifera and U. compressa, were cultured at various salinity conditions (5, 10, 15, 20, 30, 40, and 50 psu) for 3 weeks. Results showed that the growth rates, nutrient uptake, tissue nutrient contents and nutrient removal were significantly affected by salinity and species. All four species were euryhaline with the highest growth rates at 20 psu. Among the four species, U. prolifera, U. compressa, and G. vermiculophylla showed potential to be used for nutrient bioextraction in estuaries and / or land-based fish farms due to their rapid growth, high nutrient uptake, high tissue carbon and nitrogen accumulation and removal capacities.
INTRODUCTION
Marine eutrophication caused by anthropogenic sources and mariculture activities have occurred in many coastal regions around the world (Tedesco et al. 2014, Ferrol-Schulte et al. 2015). Eutrophication can change ecosystem characteristics and may cause that threatens ecosystem health (Latimer et al. 2014, Kim et al. 2015a). Attempts to control or reverse coastal eutrophication have focused on the reduction of point and nonpoint sources such as waste water treatment plants, run-off, fish waste, etc. (Tedesco et al. 2014). However, eutrophication cannot be immediately reversed by source reduction because of decades to centuries long accumulation of nutrients in benthic sediments.
The ecosystem services afforded by seaweed cultivation has been suggested as an efficient tool for the reduction of nutrients in urbanized estuaries (Kim et al. 2014, 2015b, Rose et al. 2015, Wu et al. 2017, 2018). As an extractive component of integrated multi-trophic aquaculture systems (IMTA), seaweed cultivation may remediate the impacts of intensive fish aquaculture (Chung et al. 2002, Buschmann et al. 2008, Chopin et al. 2008, Corey et al. 2013, 2014, Wu et al. 2015). The seaweed absorbs inorganic nutrients to support its growth. The ability of nutrient absorption and accumulation in seaweed is strongly influenced by environmental conditions such as nutrients, temperature, salinity, light, currents, and wind, etc. (Dawes et al. 1999, Kim et al. 2016).
The seaweed tolerance to high salinity is dependent on the internal and external osmotic potentials and on the elasticity of the cell wall. At low salinity, the strength of the cell walls and the ability of the cells to make their internal osmotic potential less negative will determine their resistance to low salinity (Hurd et al. 2014). Salinity fluctuations alter the osmolarity within the cells, causing stress on the organism. If the cell is placed in hypertonic solution, water will flow rapidly out of the cell and turgor pressure will be reduced causing plasmolysis, which is usually irreparable. When the cell is placed in hypotonic solution, water will enter the cell, causing an increase of cell volume. If the difference in osmotic potentials is great enough, the cell will be damaged irreversibly (Hurd et al. 2014).
The fluctuation of salinity is highly variable in coastal areas (Yarish and Edwards 1982, Kourafalou et al. 1996). Salinity of 0 to 30 psu is not uncommon in nearshore coastal areas (Yarish et al. 1979b, 1980, Karsten 2012). Many Gracilaria and Ulva species are known to be highly tolerant to hypo- and hyper-osmotic conditions and grow well in the salinity fluctuating environment (Latigue et al. 2003, Weinberger et al. 2008). These species are euryhaline (Bird et al. 1979, Lapointe et al. 1984, Choi et al. 2010). Some species of Gracilaria and Ulva have rapid growth rates, as well as a capacity for high nutrient uptake (Martínez-Aragón et al. 2002, Neori et al. 2003, Abreu et al. 2009, 2011, Kim et al. 2014, Gorman et al. 2017). However, relatively few species in these genera have been thoroughly evaluated. The objectives of this study were to look at the influence of salinity on the growth and nutrient bioextraction abilities of Gracilaria species (G. chorda and G. vermiculophylla) and Ulva species (U. prolifera and U. compressa); and to determine if these seaweeds can be used for nutrient bioextraction under hypo- or hyperosmotic conditions in estuaries and / or land-based fish farms as part of an integrated multi-trophic system.
MATERIALS AND METHODS
Seaweed collection and acclimation
Two Gracilaria species, G. chorda and G. vermiculophylla, and two Ulva species, U. prolifera and U. compressa were used. G. chorda was collected from Tongyeong Gyeongnam, Korea in Sep 18, 2015. This strain of G. chorda is the major cultivar in Gracilaria farms in Korea. G. vermiculophylla was collected from the eulittoral zone with high emersion stresses in Byeonsan, Jeonbuk, Korea in Sep 24, 2015. U. prolifera was originally collected from the Pyropia yezoensis aquaculture rafts at Rudong, Jiangsu Province, China in May 9, 2011. U. compressa was collected from the upper sublittoral zone in Tongyeong, Gyeongnam in Sep 18, 2015. All seaweeds were propagated at the Marine Ecology and Green Aquaculture Laboratory, Incheon National University, Korea. All species were acclimated to experimental conditions, 20°C, 12 : 12 L : D photoperiod, 100 μmol m−2 s−1 photon fluence rate and von Stosch’s enriched (VSE) seawater (Ott 1965) for 7 days. The nitrate and phosphorus concentrations in VSE were 500 and 30 μM, respectively. The salinity was maintained at 30 psu during the acclimation period with media changes every 2 days. Post-acclimation tissue samples were collected in triplicate for the subsequent analysis of tissue nitrogen and carbon.
Experimental design and samples collection
Following acclimation, healthy apical segments of each species were placed in 250 mL flasks with 200 mL VSE medium at a stocking density of 1.0 g L−1. Different salinity conditions (5, 10, 15, 20, 30, 40, and 50 psu) were set by adding Corallife Sea Salt (Franklin, WI, USA). All cultures were cultivated at the environmental conditions above mentioned (n = 3). The seaweeds were cultivated for 15 days. To eliminate the effect of evaporation flasks were sealed with Parafilm (Yarish and Edwards 1982). The culture medium was exchanged 2- to 3-day time intervals. Water samples were collected for inorganic nutrient analyses; each time there was a media change.
Biomass in each flask was weighed (fresh weight, FW) every 5 days. FW was obtained after blotting dry with paper towels. Seaweed biomass in each flask was reduced to initial stocking density (1.0 g L−1) and samples were taken for dry weight (DW) and CHN tissue analysis. DW was determined by drying to constant weight at 60°C. Specific growth rate (SGR, % d−1) was calculated using the following formula:
where S1 and S2 are the FW at days T1 and T2, respectively.
Dried tissues were ground to powder using a MM400 ball mill (Retsch, Mettmann, Germany). The total tissue nitrogen (N) and carbon (C) in each sample were analyzed by using a CHN analyzer (Series II, CHNS/O 2400; Perkin Elmer Analytical Division of E.G. & G, Wellesley, MA, USA) (Kim et al. 2007). Using the tissue N and C contents combined with biomass data, the nitrogen and carbon removal were calculated using the following equation (Kim et al. 2007):
where Bt and Tissue N are biomass (in grams) and tissue N (percent DW) at day t, while B0 is biomass at day 0.
The same calculation was used for C removal substituting tissue C for tissue N. Water samples obtained were filtered through 0.45 μm glass microfiber filters (Whatman, Buckinghamshire, UK) and kept at −20°C until measurements were made. Nitrate-nitrogen (NO3-N), and inorganic phosphate (PO4-P) concentrations were measured following Wu et al. (2015). NO3− and PO43+ uptake rates were calculated as the difference between the initial and final nutrient concentrations during each sampling period (Kim et al. 2007, 2016).
Statistical analysis
All statistical analyses were conducted using SPSS software v.17.0 (SPSS Inc., Chicago, IL, USA). Data from all treatments conformed to a normal distribution (Shapiro-Wilk, p > 0.05) and had equal variances (Levene’s test, p > 0.05). Two-way ANOVA was used to determine the effects of species and salinity on SGR, nitrate uptake, phosphorus uptake, tissue carbon, tissue nitrogen, C/N, carbon removal and nitrogen removal (n = 3). Tukey’s honest significant difference tests were conducted for post-hoc investigation. Differences between treatments were considered to be significant at p < 0.05.
RESULTS
Specific growth rate
Growth rates were significantly influenced by species, salinity and by the interaction of these two factors (p < 0.001) (Table 1). Salinity significantly influenced the growth rates in all four species (p < 0.001). G. chorda showed the slowest growth rate in comparison to other species at all conditions (Fig. 1). In G. chorda, the highest growth rate was observed at 20 psu (6.3% d−1). G. vermiculophylla grew well in a wide range of salinity (15–40 psu), with the highest growth rate at 20 and 30 psu (>20.0% d−1). U. prolifera grew well at all salinity conditions (ranged from 12.7% d−1 at 15 psu to 35.0% d−1 at 20 psu). The growth rate of U. compressa increased with salinity ranging from 10.0% d−1 at 15 psu to >19.5% d−1 at 40 and 50 psu.
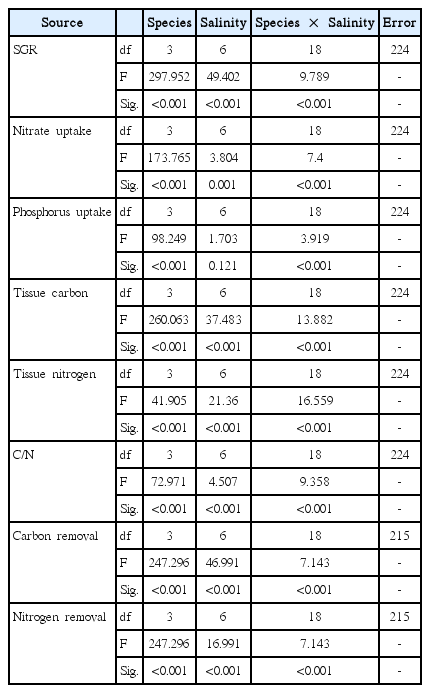
Results of analysis of variance examining the effects of species and salinity on specific growth rate (SGR), nitrate and phosphorus uptake, the tissue carbon and nitrogen contents, and carbon and nitrogen removal
Growth rates of Gracilaria chorda (A), G. vermiculophylla (B), Ulva prolifera (C), and U. compressa (D) grown at different salinity conditions. Values are presented as mean ± standard deviation (n = 3). Different letters indicate significant difference at the 0.05 level.
Nitrate and phosphorus uptakes
The ANOVA showed that the nitrate uptake was significantly influenced by species, salinity and by the interaction of these two factors (p ≤ 0.001) (Table 1). Nitrate uptake rates of G. chorda were higher with increasing salinities (15–50 psu; 6.4–11.7 μmol g−1 d−1) than those at the salinities of 5 and 10 psu (1.1 and 1.7 μmol g−1 d−1, respectively) (Fig. 2). Nitrate uptake rates of G. vermiculophylla were ranged from 10.3 μmol g−1 d−1 at 5 psu to 17.2 μmol g−1 d−1 at 15 psu. In U. prolifera nitrate uptake rates were significantly higher (25.5–27.5 μmol g−1 d−1) at the salinities of 5–15 psu than at the salinities between 20 and 50 psu (11.8–17.2 μmol g−1 d−1). Nitrate uptake rates of U. compressa were higher than other species in all the salinity conditions with the highest at 20 psu, 32.4 μmol g−1 d−1.
Nitrate uptake rates of Gracilaria chorda (A), G. vermiculophylla (B), Ulva prolifera (C), and U. compressa (D) grown at different salinity conditions. Values are presented as mean ± standard deviation (n = 3). Different letters indicate significant difference at the 0.05 level.
Phosphorus uptake was significantly influenced by species and by the interaction of these two factors (p < 0.001) (Table 1). Among four tested species, G. chorda showed the lowest phosphorus uptake rates (0.32–0.94 μmol g−1 d−1) while U. prolifera showed the highest phosphorus uptake rates (2.12–4.34 μmol g−1 d−1) at all salinity conditions (Fig. 3). The phosphorus uptake rates of G. vermiculophylla were ranged from 0.58 μmol g−1 d−1 at 5 psu to 1.41 μmol g−1 d−1 at 40 psu. In general, Ulva species showed higher phosphorus uptake rates than Gracilaria species. The phosphorus uptake rates of U. prolifera showed a similar pattern to that of nitrate uptake: higher at lower salinities and lower at higher salinities. The phosphorus uptake rates of U. compressa ranged from 0.97 μmol g−1 d−1 at 5 psu to 2.53 μmol g−1 d−1 at 20 psu.
Phosphorus uptake rates of Gracilaria chorda (A), G. vermiculophylla (B), Ulva prolifera (C), and U. compressa (D) grown at different salinity conditions. Values are presented as mean ± standard deviation (n = 3). Different letters indicate significant difference at the 0.05 level.
Tissue carbon and nitrogen contents, and C : N ratio
Tissue carbon contents were significantly influenced by species, salinity, and the interaction of these two factors (p < 0.001) (Table 1). G. chorda showed the tissue carbon contents ranged from 33.7% at 50 psu to 35.9% at 5 psu. The tissue carbon contents of G. vermiculophylla were similar at all salinity conditions: ranged from 31.0 to 32.5%. Both Ulva species showed a decline of the tissue carbon contents as salinity increased. U. prolifera had the tissue carbon content of 38.4% at 10 psu and decreased to 28.4 and 28.6% at 40 and 50 psu, respectively. The tissue carbon contents of U. compressa also decreased from 41% at 5 and 10 psu to 37% at 50 psu (Fig. 4).

Tissue carbon contents of Gracilaria chorda (A), G. vermiculophylla (B), Ulva prolifera (C), and U. compressa (D) grown at different salinity conditions. Values are presented as mean ± standard deviation (n = 3). Different letters indicate significant difference at the 0.05 level.
Tissue nitrogen contents were also significantly influenced by species, salinity, and the interaction of these two factors (p < 0.001) (Table 1). Ulva species in general cumulated higher contents of nitrogen in tissue than Gracilaria species at the salinities of 5–15 psu. G. chorda and G. vermiculophylla did not show a pattern with a salinity gradient with the highest contents at 4.15 and 4.02% at 30 psu, respectively. However, both Ulva species decreased their tissue nitrogen contents as the salinity increased, >5.1% at 5–15 psu and <3.7% at 20–50 psu for U. prolifera and >4.3% at 5–20 psu and <3.4–3.6% at 30–50 psu for U. compressa (Fig. 5).

Tissue nitrogen contents of Gracilaria chorda (A), G. vermiculophylla (B), Ulva prolifera (C), and U. compressa (D) grown at different salinity conditions. Values are presented as mean ± standard deviation (n = 3). Different letters indicate significant difference at the 0.05 level.
The C : N ratio of all species were low, ranged from 8.3 to 11.6 for G. chorda, 7.7 to 8.7 for G. vermiculophylla, 7.3 to 9.8 for U. prolifera, and 8.8 to 11.2 for U. compressa (Fig. 6).
C : N ratio of Gracilaria chorda (A), G. vermiculophylla (B), Ulva prolifera (C), and U. compressa (D) grown at different salinity conditions. Values are presented as mean ± standard deviation (n = 3). Different letters indicate significant difference at the 0.05 level.
Nutrients removal
Carbon removal was significantly influenced by species, salinity, and the interaction of these two factors (p < 0.001) (Table 1). The carbon removal of G. chorda was the lowest amongst the tested species ranging from 0.38 to 3.06 mgC g DW−1 d−1. The carbon removal of G. vermiculophylla was higher in the mid-salinities (15–30 psu; 15.36–16.33 mgC g DW−1 d−1) than at extreme conditions. Both Ulva species showed increased carbon removal at higher salinity conditions. The carbon removal of U. prolifera ranged from 7.16 to 10.32 mgC g DW−1 d−1 at 5–15 psu and 19.52 to 30.05 mgC g DW−1 d−1 at 20–50 psu. The carbon removal of U. compressa ranged from 10.42 to 15.59 mgC g DW−1 d−1 at 5–20 psu and 25.94 to 29.27 mgC g DW−1 d−1 at 30–50 psu (Fig. 7).
Carbon removal of Gracilaria chorda (A), G. vermiculophylla (B), Ulva prolifera (C), and U. compressa (D) grown at different salinity conditions. Values are presented as mean ± standard deviation (n = 3). Different letters indicate significant difference at the 0.05 level.
Nitrogen removal was also significantly influenced by species, salinity, and the interaction of these two factors (p < 0.001) (Table 1). Like carbon removal, both Ulva species and G. vermiculophylla showed higher nitrogen removal capacity than G. chorda. Nitrogen removal of G. chorda was the highest at 30 psu while that of G. vermiculophylla was optimal at a wide range of salinity conditions (15–40 psu). Nitrogen removal of G. chorda was ranged from 0.03 at 5 psu to 0.36 mgN g DW−1 d−1 at 30 psu. The nitrogen removal of G. vermiculophylla was ranged from 0.14 at 15 psu to 0.83 mgN g DW−1 d−1 at 10 psu. The nitrogen removal of U. prolifera and U. compressa were 1.01–3.02 and 1.01–2.54 mgN g DW−1 d−1, respectively (Fig. 8).
Nitrogen removal of Gracilaria chorda (A), G. vermiculophylla (B), Ulva prolifera (C), and U. compressa (D) grown at different salinity conditions. Values are presented as mean ± standard deviation (n = 3). Different letters indicate significant different at the 0.05 level.
DISCUSSION
Gracilaria chorda, G. vermiculophylla, Ulva prolifera, and U. compressa tested in the present study were tolerant to a wide range of salinities (5–50 psu). Interestingly, the highest growth rates were found at 20 psu except for U. compressa. Enhanced growth rates at lower salinities (15–28 psu) are not rare in Ulva and Gracilaria (Choi et al. 2010, Kim et al. 2016 and references therein). Both U. prolifera and U. compressa maintained high growth rates even at extreme salinity conditions, 15 and 11% d−1 at 5 psu and 23 and 20% d−1 at 50 psu, respectively. Gracilaria species also grew at these two extreme conditions although the performance of G. vermiculophylla was higher than that of G. chorda. These results suggest that these two genera are well adapted to estuarine conditions. Both Gracilaria and Ulva are known to be euryhaline genera. They are dominant in some estuaries year round (Bird et al. 1979, McLachlan and Bird 1984, Choi et al. 2010). For example, G. tikvahiae survive salinities between 8 and 60 psu with optimum from 15 to 35 psu (Bird and McLachlan 1986). G. vermiculophylla has an even wider range of tolerances to environmental stresses although the optimal salinities were found at 15 to 30 psu (Rueness 2005, Kim et al. 2016). This alga can even survive at 0.5 psu for many weeks (Weinberger et al. 2008). Ulva pertusa also grew well (>19% daily growth rate) in a wide range of salinities, 5–40 psu, although higher growth rates were observed at between 15 and 25 psu (Choi et al. 2010).
It is interesting to note that growth performance of Ulva and Gracilaria species was higher at 20 psu or higher salinities than at <20 psu. Ulva and Gracilaria species are common in the eulittoral zone, suffering some degree of hyper-osmotic (and less frequently hypo-osmotic) stress because of water evaporation (and rainfall) during emersion. Salt concentration of extracellular water during emersion can be even 10-fold higher than the ambient salt water (Satoh et al. 1983). Therefore, eulittoral species including Ulva and Gracilaria have physiological adaptations to the extremes of salinity (Hurd et al. 2014). For example, eulittoral seaweeds can in general tolerate seawater salinities of 10–100 psu while the sublittoral species are less tolerant especially to the increased salinities (Biebl 1962, Russell 1987).
Different populations (strains) of seaweeds showed physiological responses differently in different salinity conditions (Yarish et al. 1979a). The Chinese strain of U. prolifera, which is the world’s largest macroalgal bloom forming strain, showed the highest growth rate (~35% d−1) and tissue nitrogen content (~5.4%) among the seaweeds tested although the maximum growth rates of U. prolifera from other studies are quite variable (1.5–38% d−1) (Xiao et al. 2016 and references therein). These results suggest that U. prolifera has a great capacity for nutrient absorption and assimilation, resulting in ecological success over other co-occurring species, especially in eutrophic waters (Huo et al. 2016, Zhang et al. 2016, Wu et al. 2017, 2018). Gracilaria chorda, which is a major aquaculture species in Korea and China, showed the lowest growth rate (~6.3% d−1 at 20 psu) among the tested species. This is similar to (4–5% d−1) (Choi et al. 2006) or lower than the growth rates of the same species in other some studies (10–14% d−1) (Yang et al. 2006, Zhou et al. 2006, Qu et al. 2017). This variation of growth among studies may be due to the differences in seaweed strains, culturing methods and physio-chemical conditions (Liu and Dong 2001).
The nitrate and phosphorus uptakes of both Gracilaria species and U. compressa, corresponded to having higher growth and uptake rates at salinities of 20 psu and higher, with optimum at intermediate levels. In U. prolifera, however, the nitrate and phosphorus uptake were higher at lower salinities (<20 psu) than higher salinity conditions (20 psu or higher), which is opposite of the growth pattern. In a steady state, the nutrient uptake should be increasing with growth (Choi et al. 2010). In other words, when the seaweed grows rapidly, it should take up nutrients at a higher rate. However, in occasional cases, the growth and nutrient uptake may be temporally imbalanced during periods of unfavorable conditions (McGlathery et al. 1996, Trimmer et al. 2000). Interestingly, the tissue nitrogen contents of U. prolifera were much higher (5.14–5.42%) at 5–15 psu than those at higher salinities (3.39–3.60%), corresponding to the nitrate uptake pattern in this alga. These results suggest that at hypo-osmotic conditions, U. prolifera prefers to accumulate the nitrogen internally rather than to use the nitrogen for growth.
Tissue nutrients content can reflect the water column nutrient availability, and nutrient demand and utilization capacity of seaweeds (Martínez-Aragón et al. 2002, Yu et al. 2014). However, the contents can be strongly influenced by environmental factors (e.g., temperature, pH, salinity, etc.) (Hurd et al. 2014). Choi et al. (2010) reported that the tissue carbon and nitrogen contents were consistent between 5 and 34 psu, but significantly decreased at a higher salinity (40 psu). Tissue carbon and nitrogen contents of Ulva ohnoi were also significantly influenced by salinity: higher contents at 20, 25, 55, and 60 psu and lower at 35 and 40 psu (Angell et al. 2015). However, a red alga, Gelidium coulteri did not change its tissue nitrogen content in a wide range of salinities (5–45 psu) (Macler 1988). In the present study, the effect of salinity in the tissue carbon and nitrogen contents were more significant in Ulva than Gracilaria. While Gracilaria and Gelidium have thicker thalli with lower surface area to volume ratio (SA : V), Ulva has very thin filamentous or blade shape thalli with high SA : V. Seaweeds with high SA : V have advantages to take up and assimilate nutrients efficiently and to grow rapidly (Kraemer et al. 2004, Kim et al. 2007). The same phenomenon may also apply to determine the effect of salinity stress. Since all cells of Ulva are directly exposed to the external environmental stresses (salinity), the internal tissue carbon and nitrogen changes in this species may be more significant. However, the cellular and biochemical mechanisms for this phenomenon are still unclear.
To estimate nitrogen removal, the present study used a method as a function of biomass increase and total tissue nitrogen. This method is a more direct measurement of the absolute nitrogen mitigation capacity of seaweed compared to nitrogen uptake as a function of media depletion. This nitrogen removal method, therefore, is more useful tool for bioremediation applications. Carbon and nitrogen removal by Gracilaria and Ulva was affected by salinity with various optimum conditions in different species. Interestingly, the carbon and nitrogen content in U. prolifera, U. compressa, and G. vermiculophylla still remained high even at lowest salinity condition (5 psu).
Gracilaria and Ulva have been suggested as good species for nutrient bioextraction and IMTA worldwide (Neori et al. 2003, Abreu et al. 2009, 2011, Kim et al. 2014, 2017). The findings from present study also confirm that these two genera have a great capacity of nutrient bioextraction at the salinities between 20 and 50 psu. Additionally, the present study suggests that the application of these two genera (U. prolifera, U. compressa, and G. vermiculophylla) for nutrient bioextraction can be extended to even lower saline waters (e.g., 5–15 psu) for growth within IMTA systems with the fed aquaculture of marine fish / shrimp aquaculture. Aquaculture of crustaceans (e.g., shrimp) and fish using low salinity water has become more common and continues to increase globally (Boeuf and Payan 2001, Roy et al. 2010, Zheng et al. 2017). There have been attempts to utilize the low salinity fish / shrimp effluent to grow land plants and evaluated the plant yield and fish / shrimp production (Mariscal-Lagarda et al. 2012) and to estimate the bioremediation efficiency of land plants (e.g., tomatoes) (Mariscal-Lagarda and Páez-Osuna 2014). Although the land crops grew well in fish effluent, the bioremediation capacity of these plants was not promising. Fish production from brackish water aquaculture is significant, >9% of global fish production (Food and Agriculture Organization of the United Nations 2018) but there are serious water quality issues (El-Mezayen et al. 2018).
In conclusion, all four species used in the present study showed tolerance to a wide range of salinities with the highest growth rates at 20 psu. This study also suggests that Ulva prolifera, U. compressa, and G. vermiculophylla have potential to be used for nutrient bioextraction not only at the optimal salinity conditions (e.g., 20–40 psu) but also at hyper- or hypo-osmotic conditions for marine finfish / shrimp aquaculture. It is important to note that the use of Ulva should be limited to the land based systems since this alga may cause blooms in open and / or coastal waters. Their rapid growth, high nutrients uptake, high tissue carbon and nitrogen accumulation, and carbon and nitrogen removal in a wide range of salinity conditions will make them an integral component for nutrient bioextraction in estuaries and / or land-based fish farms (as part of an IMTA system).
ACKNOWLEDGEMENTS
This study was supported by Incheon National University Research Grant in 2016.