Impact of inhibitors of amino acid, protein, and RNA synthesis on C allocation in the diatom Chaetoceros muellerii: a FTIR approach
Article information
Abstract
Fourier Transform Infrared (FTIR) spectroscopy was used to study carbon allocation patterns in response to N-starvation in the nearly ubiquitous diatom Chaetoceros muellerii. The role of gene expression, protein synthesis and transamination on the organic composition of cells was tested by using specific inhibitors. The results show that inhibition of key processes in algal metabolism influence the macromolecular composition of cells and and prior cell nutritional state can influence a cell’s response to changing nutrient availability. The allocation of C can thus lead to different organic composition depending on the nutritional context, with obvious repercussions for the trophic web. This also shows that C allocation in algal cells is highly flexible and that C (and the energy associated with its allocation) can be variably and rapidly partitioned in algal cells in response to relatively short term perturbations. Furthermore, the data confirm and extend the utility of infrared spectroscopy as a probe of the metabolic state of autotrophic cells.
INTRODUCTION
Global warming as a result of increasing atmospheric partial pressure of CO2 (pCO2) can result in stronger stratification of surface waters, which among other consequences, will lead to a decrease of nutrient supply (especially N) from deeper waters (Raven et al. 2011 and references therein). This is expected to lead to changes in environmental stoichiometry that will alter resource availability for phytoplankton. In particular, an imbalance of C and N supply may affect how C is allocated within phytoplankton cells (Palmucci et al. 2011, Palmucci and Giordano 2012, Giordano 2013, Pierangelini et al. 2016). Energy transfer to subsequent levels of trophic webs and the biological C pump may be appreciably influenced by the changes in phytoplankton composition, which in turn can be influenced by shifts in nutrient supply (Falkowski and Raven 2007, Marchetti et al. 2010, Raven et al. 2012, Ratti et al. 2013).
Organisms react to changes in resource availability by redistributing resources so that their reproductive and growth potentials are affected as little as possible (Geider and Osborne 1989, Montechiaro and Giordano 2010, Giordano 2013). This often requires that compositional homeostasis is sacrificed, although the degree by which this occurs depends on the intensity of the environmental perturbation and on its duration relative to the length of the reproductive cycle of the organisms (Fanesi et al. 2014). Regulation, acclimation or adaptation responses can be enacted to different degrees and at different times depending on conditions and species (Giordano 2013). The organic cell composition will in fact determine the nutritional value of cells and could decisively impact on their density (i.e., sinking rate) (Norici et al. 2011, Palmucci et al. 2011, but see Pantorno et al. 2013) and stoichiometry, and thus their impacts on energy transfer within a food web and the biological C pump.
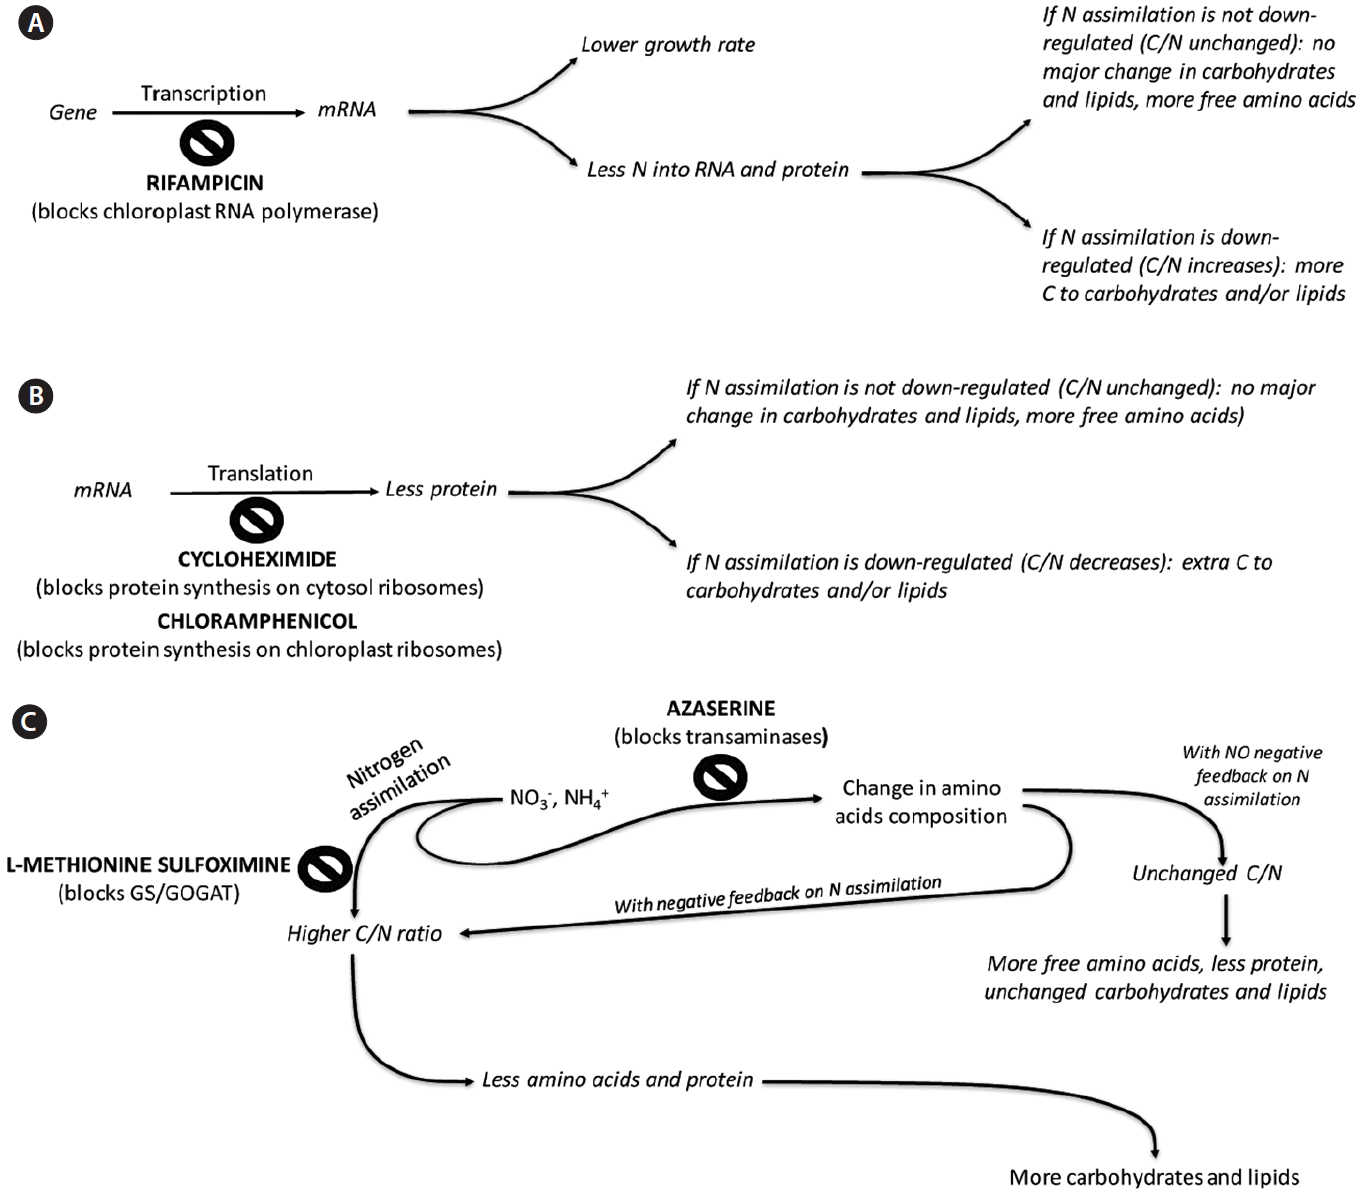
With these matters in mind, we attempted to get a depiction of the involvement of key cellular processes, and particularly N-related metabolism, in the formation of cell biomass, by dissecting metabolism through the use of inhibitors of protein synthesis on 70S and 80S ribosomes, of RNA synthesis, of transamination and of amino acid synthesis (Fig. 1). We also tried to use this approach to obtain information on the mechanisms that control C allocation in cells.

Expected impact of the inhibitors on C allocation. GS, glutamine synthetase; GOGAT, glutamine oxo-glutarate aminotransferase.
The study of these problems would benefit from methods that facilitate the contextual measurement of the main organic pools, especially in relation to each other. Unfortunately, most of the methods used for the assessment of organic cellular pools and of their variations are rather cumbersome. The “wet chemistry” approach traditionally used potentially introduces both large experimental errors and major perturbations to the system. Also, wet chemistry techniques are often technically challenging, costly and time consuming, and often require large sample mass.
The main technical difficulty associated with this task is the necessity for methods that, while being reliable, relatively simple and cost effective, also allow for minimal sample manipulation (and thus reduce the risk of introducing analytical artifacts) and small sample sizes. Fourier Transform Infrared (FTIR) spectroscopy meets these requirements, because it can be applied to all pools at the same time, to whole cells without the need for complex extraction steps, and with a reliability that has been proved over the years (e.g., Naumann et al. 1991, Heise 1997, Giordano et al. 2001, Sackett et al. 2014).
We are of course aware of the fact that the specificity of inhibitors is rarely absolute and artifacts can be generated, but the matrix of treatments, coupled with the minimally invasive analytical methods should allow us to provide a reasonably reliable picture of the involvement of the various processes. In any case, this paper intends to be only a step in the direction of understanding C allocation in a changing world. It is our hope that it will inspire further detailed studies by research groups with greater technical possibilities than we have. In this work we used the marine diatom Chaetoceros muellerii Lemmermann, a frequent and often abundant component of phytoplankton, as our experimental organism.
MATERIALS AND METHODS
All the experiments were carried out on batch cultures of Chaetoceros muellerii Lemmermann (Strain CS-176; CSIRO Culture Collection, Hobart, Australia) grown in a modified form of ‘D’ medium of Provasoli et al. (1957) buffered at pH 8.0, and maintained at 18°C (±0.1°C) under a continuous photon flux density of 150 μmol m−2 s−1. For the “NH4+-cultures,” NO3− was substituted with an equal concentration (1.5 mM) of NH4+. For the nitrogen starvation treatment, the medium was prepared in the absence of any nitrogen source. The batch cultures were inoculated from low cell density “air-lift” semi-continuous cultures, in the early exponential phase. The size of the inoculum was such that the initial cell concentration in the batch cultures was about 5 × 10⁴ cells mL−1. Exponentially growing cultures, at a cell density of about 50 × 105 cells mL−1, were pelleted by centrifugation at 500 ×g for 15 min, washed twice in nitrogen-free or nitrogen-replete medium, and transferred to an equal volume of the same medium. For the inhibitor experiments, controls were run by subjecting the cells to transfer from N-replete to N-replete or from N-replete to N-depleted conditions, in the absence of inhibitors. As controls, cells growing under N sufficiency with specific growth rates of 0.89 (0.02) d−1 and 1.05 (0.02) d−1 for NO3−- and NH4+-grown cells, respectively (n = 5), were transferred to N-sufficient conditions and to N-limited conditions, without the addition of any inhibitor.
The cell density of the batch cultures was determined with a Neubauer hemocytometer, after fixation with Lugol’s iodine solution. Sterile stocks of methionine sulfoximine (MSX), azaserine (O-diazo-acetyl-L-serine, AZA), cycloheximide (CHX), chloramphenicol (CAP), and rifampicin (3-[4-methylpiperaziniliminomethyl]-rifampicin, RIF) were prepared and then added to the cultures to a final concentration of 100 μM for all except RIF, which was used at a concentration of 10 μM. The targets for each of these inhibitors are given in Table 1.
Sample preparation, FTIR measurement and spectral analysis were effected as previously described (Giordano et al. 2001, Palmucci et al. 2011). Band assignments are based on previous studies on whole cells, organelles and macromolecules. The contribution of specific biological molecules to the bands was also validated with standards as shown in Giordano et al. (2001) and Palmucci et al. (2011). The absorption bands used in this work were the ~1,740 cm−1 band attributed to the C=O group of esters (stretching vibrational mode), which is primarily due to lipids and fatty acids, the ~1,650 cm−1 band of the stretching vibration of C=O groups associated with proteins (Amide I [AI]), and the ~1,540 cm−1 band due the bending vibration of N-H functional groups of amides associated with proteins (Amide II [AII]). Spectra were normalised to the stretching vibration of Si-O (Silica band) at 1,076 cm−1 to account for differences in the deposit thickness. Independent determination of the silica content per cell showed that, with the exception of CHX exposure (see below), this did not appreciably change over the course of the experiment or among treatments (data not shown).
The observation of increased AI absorbance under CHX treatment raised the possibility that inhibited protein (re)synthesis might have led to high absorbance from un-polymerised amino acids/peptide pools, so we processed these data by deconvolution analysis in order to determine the contribution to the AI band from various secondary protein structures. Thus, for the CHX treatments, data from the AI bands spectra were deconvoluted using The Unscrambler software. This allowed the contributions from the various secondary structure configurations (β-sheets, α-helices, turn regions, and unordered peptide chains) to be determined (band assignments were after Goormaghtigh et al. 1990 and Kong and Yu 2007).
The variance of mean values was tested with two-way ANOVA. Bonferroni’s significant difference test was used for post hoc treatment comparisons. All statistical analyses were performed using the software GraphPad Prism version 5 (GraphPad Software, La Jolla, CA, USA). The significance level was fixed at p < 0.0001 for n ≥ 3. All measurements are reported as mean ± standard deviation (in the text as values in parentheses).
RESULTS AND DISCUSSION
Control experiments (in the absence of inhibitors)
Transfer of the cells from the semi-continuous culture to batch cultures had an impact on the growth rate, which altered rather abruptly over the first day, even when the N concentration was not changed (and changes were more marked when the medium was deprived of N) (Table 2), and then stabilized (and in some cases rose) over the following 2–3 days.

Specific growth rates (μ) calculated for each period of 24 h for Chaetoceros muellerii cultures transferred from N-replete (1.5 mM) air-lift cultures containing either NO3− or NH4+ as the N-source to N-depleted (N−) or N-replete (N+) flask batch cultures, and subjected to inhibitor treatments
In the N-replete controls, transient changes in the cell pools were observed, as especially indicated by the decrease (relative to the silica peak) of the AI, AII, and lipids (1,740 cm−1) absorption bands, but the values recovered to approximately the initial values within 3 days (Fig. 2A). These changes occurred without obvious variation in the ratio between the absorption of protein-related bands (AI and AII) and the lipid band. This is suggestive of the fact that C partitioning between these two pools continued with “business as usual,” in spite of the decrease in growth rate, i.e., compositional homeostasis was maintained in spite of the changes in growth rate. It should be noted that the large Si peak associated with diatom frustules masks the signal from carbohydrates so changes to carbohydrate pool sizes could not be determined in our experiments (Giordano et al. 2001).

Fourier Transform Infrared (FTIR) absorbance of lipids, amide I and amide II in Chaetoceros muellerii control cells transferred to N-replete (A) and N-free (B) growth medium.
When the cells were transferred to N-free medium, after an initial parallel decline of both lipids and protein, 2 days after transfer, the protein content (relative to silica) stabilized, whereas the lipids tended to increase appreciably (Fig. 2B). This response is rather typical of diatoms subject to N deprivation and indicates an increased allocation of storage C to the lipid pool (Giordano et al. 2001, Palmucci et al. 2011, Palmucci and Giordano 2012). Both in the case of a transfer from N-replete to N-replete media or from N-replete to N-deplete media, no difference was observed between cells originally adapted to growth in the presence of either NO3− or NH4+, indicating that the broad macromolecular composition was independent of the oxidation state of the N source, despite the effect of N source on growth rate. It should be considered that the energetic advantage of using NH4+ becomes relevant when energy (= light for a phototroph such as C. muellerii) is in short supply and its effect on C allocation may become more prominent as the energy limitation becomes greater (Ruan and Giordano 2017). In our growth conditions, light is most likely at the edge of light-limitation (Beardall unpublished data); this may explain the relative lack of sensitivity of cells to the N source.
Inhibitor treatments
MSX
Cells treated with 100 μM MSX, an irreversible inhibitor of glutamine synthetase (GS), were unable to survive in the absence of N. In N-replete conditions, cell growth relative to the controls was not appreciably affected until the 4th day, when growth rates were significantly lower than in the control (Table 2). This may be due to the lower ability of cells under this treatment to assimilate new inorganic N (in most photosynthetic organisms, GS is the main entry point of ammoniacal N into organic matter) and to recycle amino acids (the GS/glutamine oxo-glutarate aminotransferase [GOGAT] cycle is crucial in the recovery of metabolic NH4+ from photorespiration and catabolism). The fact that the MSX treated cells were unable to grow under N starvation, but maintained a positive growth rate when N was present, is indicative of alternative routes of N assimilation, although at very low rates (growth is presumably controlled by the rate of these alternative N acquisition pathways). It is possible, for instance, that some production of glutamate may occur via glutamate dehydrogenase or in the urea cycle via ATP-dependent carbamoyl phosphate synthesis from ammonia and bicarbonate (with the catalysis of a carbamoyl phosphate synthase I, which is present in diatoms) (Allen et al. 2011), thereby bypassing GS activity. In diatoms, the expression of amino acid metabolism genes is both up-regulated and down-regulated by N starvation; among the up-regulated genes, a number of transaminases are found (Hockin et al. 2012) that may, on the one hand, be involved in N storage and on the other may represent an alternative to the GS/GOGAT systems for the redistribution of assimilated N; the slow growth rates observed in the C. muellerii treated with MSX in the presence of N may be associated with these processes.
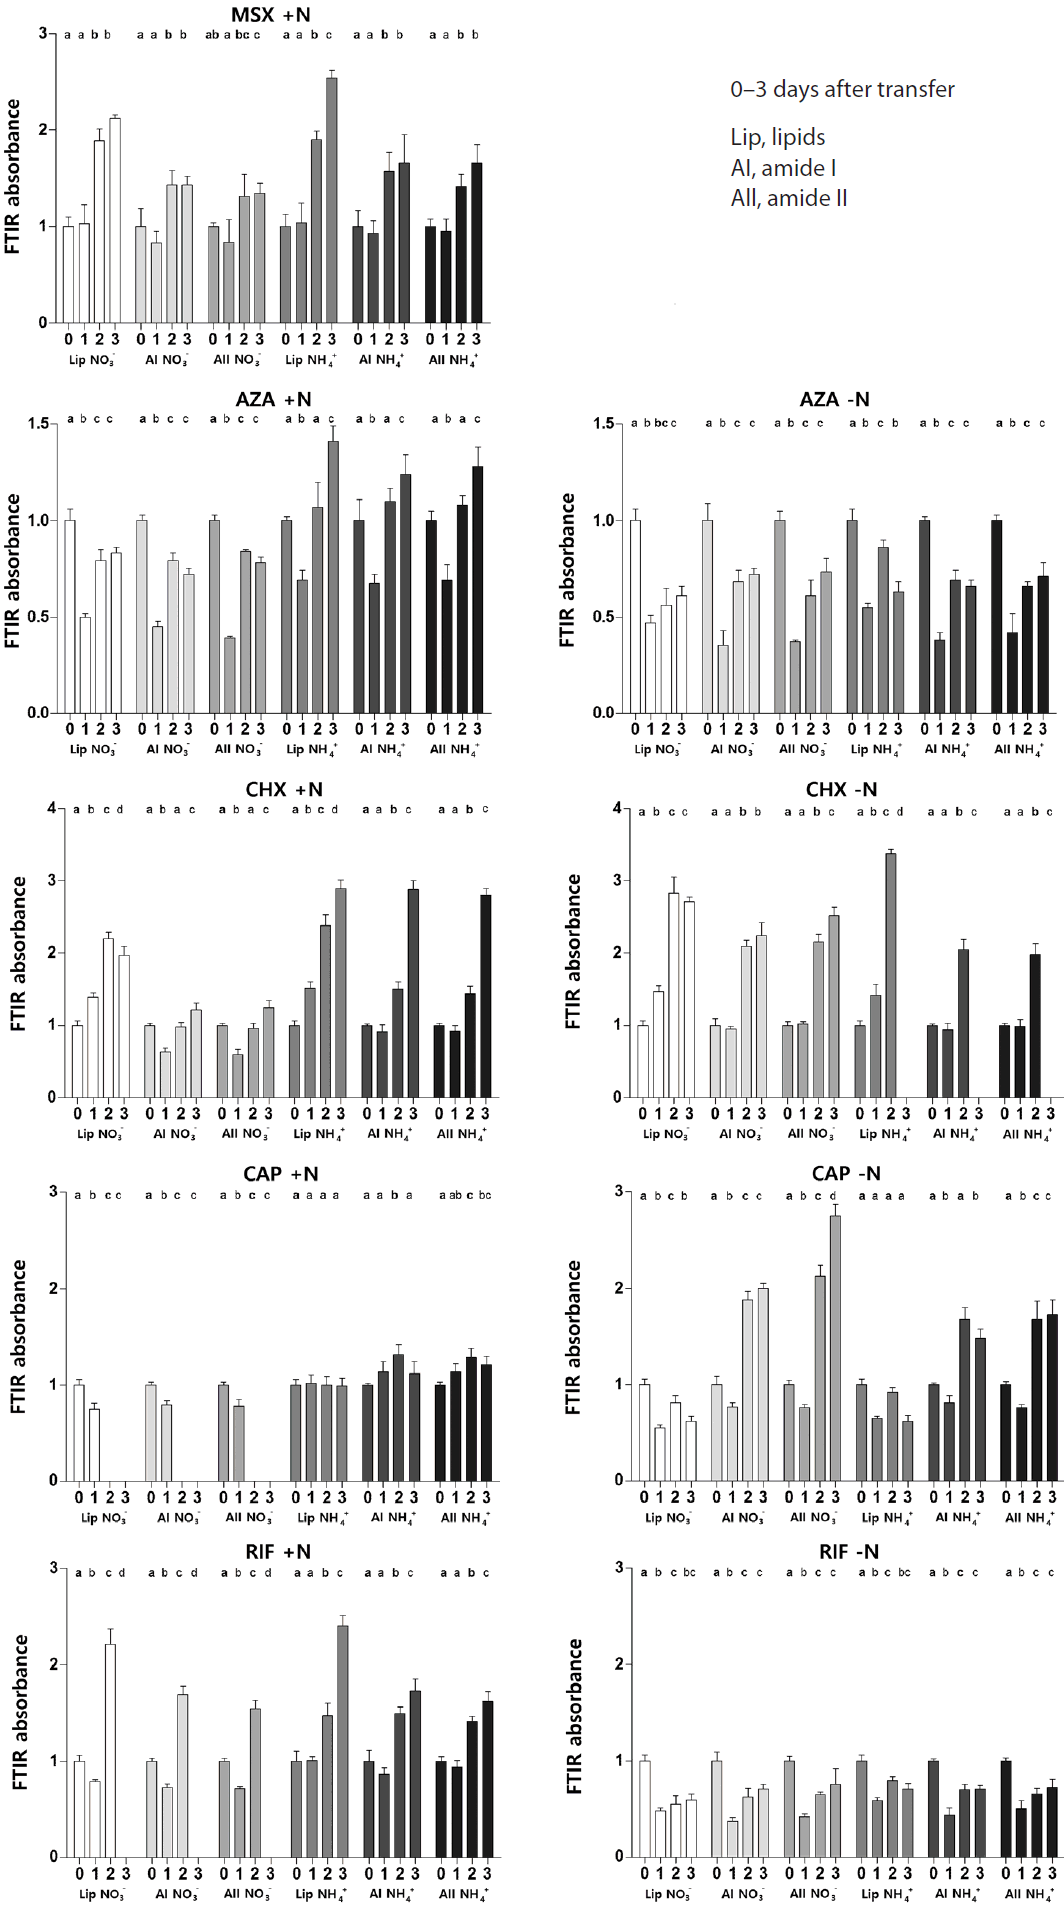
GS inactivation is likely to cause an increase in the C : N ratio in the organic pools. This is confirmed by the fact that, as long as growth was maintained, the FTIR-determined ratio between lipid and silica tended to increase in MSX-treated cells relative to time zero and to the controls (Fig. 3). A number of C metabolism genes were found to be up-regulated in expression studies conducted in diatoms subject to N starvation (Hockin et al. 2012). Typically a low glutamine concentration, in algae, is a signal for the diversion of C skeletons towards C pathways leading to C storage or to the synthesis of pools low in N (Huppe and Turpin 1994). However, in our experiments the protein pool size (relative to silica) increased (Fig. 3). This increase is of a similar extent to that of lipid in the first two days, and may just be fed from N reserves; as opposed to the case of lipids, however, it levels off before growth slows down, possibly as a result of the shortage of newly assimilated N.

Fourier Transform Infrared (FTIR) absorbance of lipids, amide I and amide II in Chaetoceros muellerii cells transferred to N-replete and N-free growth medium after addition of metabolic inhibitors. MSX, methylsulfoximine; AZA, azaserine; CHX, cycloheximide; CAP, chloramphenicol; RIF, rifampicin. Each bar is the mean value of 3 independent replicates and standard deviations are shown. Data are expressed relative to the mean values at time = 0 before addition of inhibitor. Different letters in the superscripts indicate statistically different values for distinct time points within the same treatment. See Supplementary Table S1 for the results of statistical tests.
AZA
AZA is a glutamine analogue that inhibits transaminases and other enzymes that use glutamine as substrate; it has often been used as an inhibitor of GOGAT. AZA, as opposed to MSX, did not prevent cell growth in the N-free medium for the duration of the experiment (Table 2). This is probably due to the fact that glutamine can also operate as a N donor independently from GOGAT. The impact of AZA on growth was slightly less marked in the cells that were previously supplied with NH4+ than in those grown in the presence of nitrate (Table 2). In the N-replete cells, the protective role of NH4+ also emerges with respect to organic composition: besides a transient decrease of lipid and protein pool size, the N-replete NH4+-grown cells maintained their organic composition essentially unchanged (Fig. 3). The lipid, AI, and AII FTIR ratios relative to silica decreased more appreciably (Fig. 3), although modestly, in the presence of NO3−. In N-deplete conditions, regardless of whether the cells had been previously exposed to NO3− or NH4+, the size of both the lipid and protein pools dropped (relative to the controls) in the presence of AZA (Fig. 3). The fact that NH4+ is fixed into glutamine, but glutamine utilization is hampered by the impossibility of its conversion to glutamate via GOGAT when AZA is present, in combination with the signalling role of glutamine for the coupling of C and N metabolism (Huppe and Turin 1994), may be at the basis of the concomitant decrease in protein and lipids (i.e., the high concentration of glutamine would curb the diversion of C skeletons to lipids and carbohydrates, and the impaired utilization of glutamine due to the inhibition of GOGAT would interfere with protein production). The control mechanisms and the interaction between the basal N assimilation pathway and the urea cycle in diatoms are not yet known in detail; it may be hypothesized that, as for the interaction between N and C metabolisms, the presence of relatively high glutamine concentrations, indicating sufficient rates of N assimilation, prevent the induction of the N-scavenging urea cycle (Allen et al. 2006, 2011).
CHX
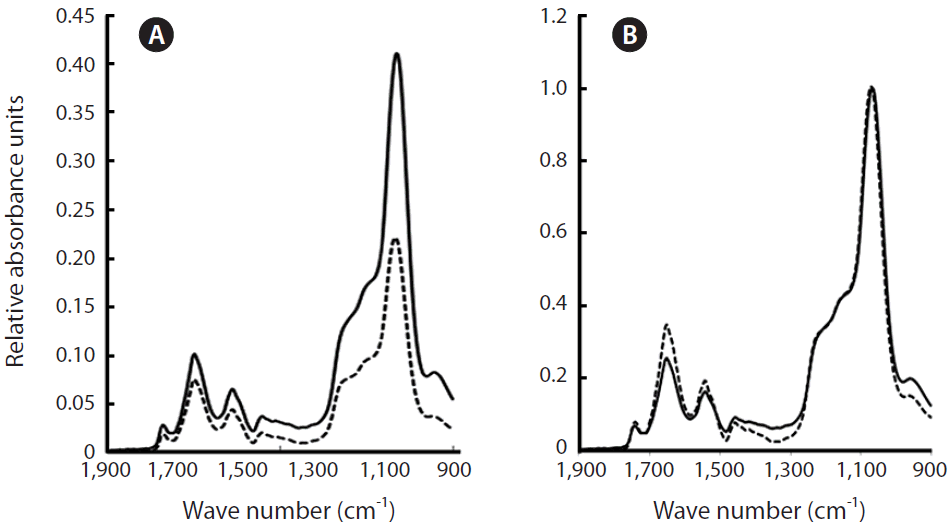
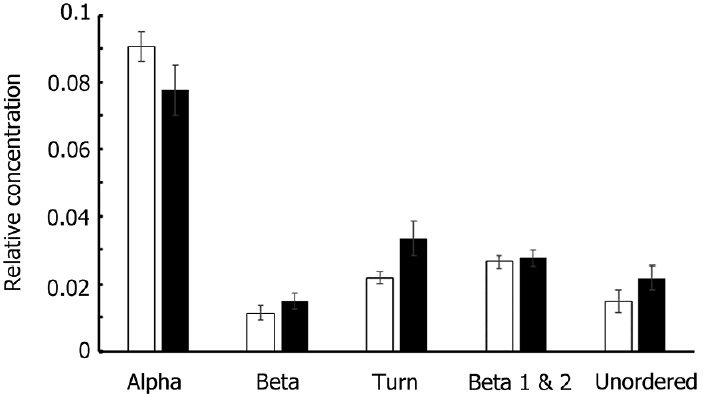
The addition to our cultures of CHX, which inhibits protein synthesis on 80S ribosomes, strongly depressed growth (Table 2). The protein content was little affected on day 1 (except for the NO3−-N+ treatment); however, from day 2, the FTIR absorbance of the amides showed an increase above the initial level (except, again, for the NO3−-N+ treatment, in which the amides’ absorbance went back to the value at day 0). This was especially obvious for cells subject to N starvation and for cells that, prior to the starvation treatment, had been exposed to NH4+ as the sole N-source (Fig. 3). In the presence of CHX, lipids (relative to silica) tended to increase slightly over time. Initially, it is counterintuitive that the protein : silica ratio should rise under treatment with CHX, a potent inhibitor of protein synthesis. However, it should be remembered here that our results were normalized to the silica band. CHX also has a strong inhibitory effect on silicification (Blank et al. 1986) so it is possible that increased amide: Si ratios reflect a decrease in Si levels in the cells rather than actual increases in protein. Fig. 4 indicates that this is the case. Fig. 4A shows that when spectra were not normalised to the Si band, AI and AII peak heights, as well as the Si peak, declined under CHX treatment and that it is only when normalised to the Si peak at ~1,074 cm−1 that the amide peaks appear to increase (Fig. 4B). Fig. 5 confirms that there were no changes in protein secondary structure under CHX treatment, ruling out any change in unstructured proteins and/or free peptides as contributing to the apparent increase in amide : Si peaks.

Fourier Transform Infrared (FTIR) spectra for Chaetoceros muellerii control cells (solid line) and cells exposed to cycloheximide (dotted line) when spectra were not normalized (A) and were normalized (B) to the peak from the silica frustule at ~1,074 cm−1. Data taken from day 3.

Results of deconvolution analysis of the amide I region of spectra shown in Fig. 4. Different secondary structures influence the shape of the main peak and this can be resolved into individual contributions from the different structures (Goormaghtigh et al. 1990, Kong and Yu 2007). The data here show that cycloheximide treatment (black bars) had no significant (p > 0.05 in all cases) effect on the secondary structure of proteins compared to controls (open bars). Alpha, alpha helices; Beta, beta sheets; Turn, turns and loops between structured regions such as alpha helices and beta sheets; unordered, regions of no secondary structure and un-polymerized peptides.
CAP
When protein synthesis on 70S ribosomes was inhibited by CAP (which binds to the ribosomes), there was a rapid and major inhibition of growth rate, which relaxed on days 2–3. In terms of macromolecular pools, there was a slight decrease in lipid and AI and AII bands in NO3−-grown cells, but in NH4+-grown cells there was a small increase in AI and AII and lipids showed no change. In contrast, when cells from culture in NO3− were subsequently starved of N, AI and AII increased strongly on days 2 and 3, and similar, though smaller, changes were observed in NH4+-grown cells subjected to N-starvation. No consistent trend in lipid levels were observed in starved cells under either N source (Fig. 3). The stimulation of protein content in N-starved cells treated with CAP was unexpected and since we could find no evidence in the literature for an effect of CAP on Si metabolism (as is the case for CHX treatments, see above), this requires further investigation.
RIF
The inhibition of chloroplast transcription by RIF (which binds to subunit 1 of RNA polymerase) resulted in changes in the AI and AII peaks that were of opposite sign depending on whether the cells were N-sufficient or N-starved. N-starved cells showed, in most cases, a reduction of AI, AII, and lipid absorbance (Fig. 3). In N-replete cells, an initial decrease in AI, AII, and lipids peaks was followed by a recovery, with the peaks becoming higher than in untreated control cultures by day 2. RIF would ultimately shut down metabolism and lead to cell death; however, even though cell growth had ceased under RIF treatment, in the short term metabolism is clearly undergoing changes affecting macromolecular composition.
Clearly, the treatments to which the alga was exposed in the experiments described here brought about a range of changes in cellular composition. While many of these are consistent with the literature reports of changes induced by similar culture manipulations (e.g., increase in lipid to protein under N-starvation), some shifts were unexpected (e.g., increase in protein bands relative to Si under CHX treatment) and require further investigation. Nonetheless our investigations reinforce the concept that FTIR offers a rapid and effective approach, avoiding wet chemistry and large amounts of sample, to investigate changes in cellular composition of living organisms.
It is worth highlighting that our data show that cell composition changes by a rather large extent in a relatively short time (1 day, the maximum time resolution afforded by our experimental design), in response to N deprivation. This may have relevance to ecology and trophic webs in an environment with patchy nutrient distribution.
CONCLUSION
In this study, we investigated the ability of Chaetoceros muellerii cells to alter C allocation patterns upon application of inhibitors of flow of materials into specific pathways. The inhibitors used influenced the coupling of C and N metabolism and affected the macromolecular composition of algal cells. The changes in lipid, proteins and carbohydrates observed were in keeping with the known mechanisms of action of the inhibitors and were easily determined using FTIR spectroscopy, illustrating the efficacy of this technique for rapid determination of cell composition.
SUPPLEMENTARY MATERIAL
p-values resulting from the Bonferroni post-tests performed in the two ways ANOVA shown in Fig. 3 (www.e-algae.org).
Abbreviations
AI
amide I
AII
amide II
AZA
azaserine
CAP
chloramphenicol
CHX
cycloheximide
FTIR
Fourier Transform Infrared
GS
glutamine synthetase
GOGAT
glutamine oxo-glutarate aminotransferase
MSX
methionine sulfoximine
RIF
rifampicin
