Ingestion rate and grazing impact by the mixotrophic ciliate Mesodinium rubrum on natural populations of marine heterotrophic bacteria in the coastal waters of Korea
Article information
Abstract
We explored feeding by the mixotrophic ciliate Mesodinium rubrum, heterotrophic nanoflagellates (HNFs), and small ciliates (<30 μm in cell length) on natural populations of heterotrophic bacteria in Masan Bay, Keum River Estuary, and in the coastal waters of the Saemankeum area, Korea when M. rubrum red tides occurred. We also measured ingestion rates of M. rubrum on cultured heterotrophic bacteria as a function of bacterial concentration in the laboratory. The ingestion rates of M. rubrum on natural populations of heterotrophic bacteria (2.3–16.8 bacteria grazer−1 h−1) were comparable to or lower than those of co-occurring HNFs (10.7–41.7 bacteria grazer−1 h−1), but much lower than those of co-occurring small ciliates (76.0–462.2 bacteria grazer−1 h−1). However, the maximum grazing coefficient of M. rubrum (0.245 d−1) on natural populations of heterotrophic bacteria was much higher than that of small ciliates (0.089 d−1), and slightly higher than that of HNFs (0.204 d−1). With increasing bacterial concentrations, ingestion rates of M. rubrum on cultured heterotrophic bacteria continuously increased, but became saturated at higher prey concentrations over 1–5 × 10⁶ cells mL−1. The maximum ingestion rate of M. rubrum on cultured heterotrophic bacteria was 34.4 bacteria grazer−1 h−1. Based on the present study, it is suggested that M. rubrum may be an important grazer of heterotrophic bacteria and sometimes have considerable grazing impact on natural populations of heterotrophic bacteria.
INTRODUCTION
Mesodinum rubrum Lohmann 1908 is a ubiquitous photosynthetic ciliate (Packard et al. 1978, Smith and Barber 1979, Lindholm 1985). This ciliate often becomes dominant as a major planktonic primary producer and recurrently cause red tides in many bays and estuaries (Taylor et al. 1971, Yih et al. 2013). In the dynamics of M. rubrum red tides, its trophic mode is very important. M. rubrum is revealed to be a mixotrophic organisms; it has plastids in the protoplasm (Lohmann 1908), but it is able to feed on heterotrophic bacteria, the cyanobacterium Synechococcus sp., and cryptophytes (Yih et al. 2004, Myung et al. 2006, Hansen et al. 2012, Yoo et al. 2015, Kim et al. 2016).
Marine heterotrophic bacteria are one of the major components and numerically dominate the abundance of plankton in marine environments (Azam et al. 1983, Cole et al. 1988). Mixotrophic algae, heterotrophic nanoflagellates (HNFs), heterotrophic dinoflagellates, and small ciliates (<30 μm in cell length) are known to be major grazers of marine heterotrophic bacteria and thus transfer energy from bacteria to upper trophic level grazers in the microbial loop (Fenchel 1982, Azam et al. 1983, Porter et al. 1985, Sherr and Sherr 1988, Seong et al. 2006, Jeong et al. 2008). Myung et al. (2006) for the first time reported that M. rubrum was able to ingest marine heterotrophic bacteria. However, the ingestion rate and grazing impact of M. rubrum on natural populations of heterotrophic bacteria remain poorly understood. Therefore, it is worthwhile to investigate grazing impacts of M. rubrum on the natural populations of heterotrophic bacteria in diverse marine environments and then compare with those of HNFs and small ciliates.
In the present study, we investigated the ingestion rate and grazing impact by the natural populations of co-occurring M. rubrum, HNFs, and small ciliates on the natural populations of heterotrophic bacteria in three characteristic Korean coastal waters (Masan Bay, Keum River Estuary, and the coastal waters of the Saemankeum area) during M. rubrum red tides in 2006. In addition, we measured ingestion rates of M. rubrum on cultured heterotrophic bacteria as a function of the bacterial concentration in the laboratory. The results of the present study provide a basis on understanding the interaction between M. rubrum and co-occurring marine heterotrophic bacteria as well as the possible competition with HNFs and small ciliates for the available heterotrophic bacterial prey.
MATERIALS AND METHODS
Grazing of Mesodinum rubrum, HNFs, and small ciliates on natural populations of marine heterotrophic bacteria in the coastal waters of Korea
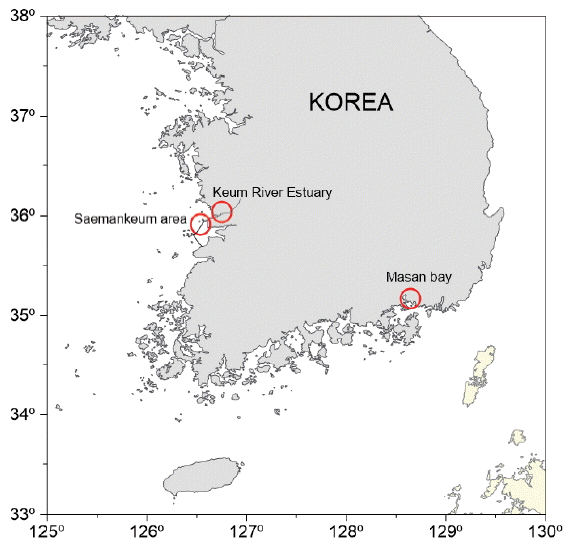
Water samples were taken from the surface in Masan Bay, Keum River Estuary, and the coastal waters of the Saemankeum area by using water samplers during Mesodinium rubrum red tides in May and October 2006 (Fig. 1). Water temperature and salinity of the surface waters were measured using YSI 30 (YSI, Inc., Baton Rouge, LA, USA), and pH and dissolved oxygen (DO) were measured using pH-11 (Schott handy-Lab; Schott Instruments, Mainz, Germany) and Oxi 197i (WTW Gmbh, Weilheim, Germany), respectively (Table 1).
To determine the abundance of Mesodinium rubrum and small ciliates (<30 μm in cell length), aliquots of the water samples were poured into 500-mL polyethylene (PE) bottles and preserved with acidic Lugol’s solution. The preserved samples were concentrated to 1/5–1/10 of the original volumes following the settling and siphoning method (Welch 1948). After thorough mixing, all or >500 cells for M. rubrum and >20 cells for small ciliates in 3 to 11 Sedgwick-Rafter counting chamber were counted under a light microscope (Olympus BX50; Olympus Co., Tokyo, Japan).
To determine the abundance of marine heterotrophic bacteria and HNFs, aliquots of the water samples were poured into 100-mL PE bottle and preserved with glutaraldehyde (final conc. = 1% v/v). Three to twelve 1-mL aliquots of the fixed samples were stained with 4′,6-diaminido-2-phenylindol (DAPI; final conc. = 1 μM) and then filtered through 0.2-μm nucleopore polycarbonate black membrane filters (Whatman, GE Co., Pittsburgh, PA, USA). Marine heterotrophic bacteria were enumerated under an epifluorescence microscope (Olympus BX50; Olympus Co.) with UV light excitation (Porter and Feig 1980). In addition, to determine the abundance of HNFs, three 1- to 5-mL of the glutaraldehyde fixed aliquots were stained with DAPI and then filtered onto polycarbonate black membrane filters of 0.2-μm pore sized. HNFs were also enumerated under an epifluorescence microscope with UV light excitation. HNFs could be distinguished from autotrophic nanoflagellates through orange-colored autofluorescence under blue or green light excitation.
Experiment 1 was designed to measure the ingestion rates of M. rubrum and co-occurring HNFs and small ciliates on natural populations of marine heterotrophic bacteria in diverse Korean waters (Table 2). The samples for grazing experiments were screened gently through a 90-μm Nitex mesh and placed in 250-mL polycarbonate bottles. Two to three days before experiment 1, marine heterotrophic bacteria cells collected from the same site were fluorescently labeled (FLBs) using the method as described by Sherr et al. (1987). To remove any aggregated FLB, the FLBs were dispersed throughout the medium using a sonicator (cleaner 5510E-DTH; Bransoic Ultrasonics, Danbury, CT, USA) for 30 min and then filtered through 2-μm pore sized filter (Whatman, GE Co.). In this experiment, the FLBs were mostly rods (a cylinder) and rarely spherical. We measured the length and the width of over 30 FLB cells in this experiment under an epifluorescence microscope, as described by Lee and Fuhrman (1987). And, we calculated the cell volume according to the following equation: volume = [π(3L - W)/3 × (W/2)2] for a rod (cylinder) and 4/3 × [π R3] for a sphere, where L is length, W is width, and R is radius, as described by Lee (1993). The size of fluorescent beads (0.47 μm, size data supplied by the manufacturer; Polyscience Inc., Warrington, PA, USA) was also measured to calibrate our results. The ranges of the length and width of FLBs (±standard error [SE]) used in this field study were 1.32 (±0.07) μm and 0.74 (±0.06) μm, respectively. The mean (±SE) volume of FLBs was 0.66 (±0.14) μm3. The ratios of the actual initial abundance of FLBs relative to that of natural populations of heterotrophic bacteria were 25–35%. FLBs were added to triplicate bottles with whole water samples (Masan Bay, Keum River Estuary, and in the coastal waters of the Saemankeum area) collected from the red tide sites. One control bottle (without FLB) was also set up for each experiment. The bottles were placed on shelves and incubated at a temperature equivalent to that of the water temperature at the sampling site under continuous illumination of 30 μmol photons m−2 s−1 of cool white fluorescent light. After 1, 10, 20, and 30 min incubation, 10 mL aliquots were removed from each bottle, transferred into 20 mL vials, and then fixed with borated-buffered formalin (final conc. = 5%). The fixed samples were filtered onto polycarbonate black membrane filters of 0.2-μm pore size. Green inclusions (FLB) inside 70 to 100 M. rubrum cells and 10 to 30 cells of small ciliates and HNFs on the polycarbonate black membrane filters were enumerated under an epifluorescence microscope with blue light excitation. The ingestion rate of a grazer on FLBs (FLBs grazer−1 h−1) was calculated by linear regression of the number of FLBs per grazer cell as a function of incubation time as described by Sherr et al. (1987). Furthermore, the ingestion rate of the grazer on heterotrophic bacteria (bacterial cells grazer−1 h−1) was calculated by multiplying the ingestion rate of the grazer on FLBs by the ratio of the abundance of natural populations of heterotrophic bacteria relative to that of FLBs.

Ingestion rate (IR, bacteria grazer−1 h−1), clearance rate (CR, nL grazer−1 h−1), and the calculated grazing impact by Mesodinium rubrum, heterotrophic nanoflagellate, and small ciliate grazers on marine populations of heterotrophic bacteria in the Korean coastal waters during M. rubrum red tides in 2006
The grazing impact (g, d−1) was calculated as follows:
where CR (mL grazer−1 h−1) is the clearance rate of M. rubrum cell on marine heterotrophic bacterial prey at a given bacterial concentration and GC is M. rubrum concentration (cells mL−1).
The clearance rates were calculated as follows:
where IR (cells grazer−1 h−1) is the ingestion rate of the M. rubrum on heterotrophic bacteria and PC (cells mL−1) is the heterotrophic bacteria prey concentration.
Prey concentration effect on ingestion rates of Mesodinium rubrum in the laboratory
Experiment 2 was designed to investigate the ingestion rates of Mesodinium rubrum on cultured heterotrophic bacteria as a function of prey concentration.
Two to three days before the experiment 2, the heterotrophic bacterial cells from non-axenic culture of M. rubrum MR-MAL01 (Yih et al. 2004) were filtered onto 1.2-μm pore size filter paper and incubated on plate medium for 5 days in the nutrient agar broth (Andersen et al. 1974). We selected the heterotrophic bacteria cells under an epifluorescence microscope and prepared FLB with the fluorescent dye 4′,5-(4,6-dichlorotriazin-2-yl) aminofluorescein (DTAF) by Sherr et al. (1987) as described above. We also measured the length and width of over 50 FLB cells under an epifluorescence microscope.
Dense cultures of M. rubrum MR-MAL01 mixotrophically grown on cryptophyte prey, Teleaulax amphioxeia CR-MAL01 (Yih et al. 2004, Kim et al. 2016), were starved for 7 days. M. rubrum cells were then subsampled using a siphon, and diluted to the target concentrations by adding autoclaved seawater to the subsamples.
Carbon contents of heterotrophic bacteria were estimated from cell volumes by using the following formula: pg C cell−1 = 0.12 V 0.7 (Simon and Azam 1989, Norland 1993), where V is the cell volume (μm3) of the heterotrophic bacteria.
The initial abundances of M. rubrum and heterotrophic bacteria were established using a pipette to deliver predetermined volumes of known cell concentrations to the bottles. Triplicate 80-mL experimental bottles (containing mixtures of M. rubrum and FLB) and triplicate grazer control bottles (containing M. rubrum only) were also established. All the bottles were then filled to capacity with freshly filtered seawater, capped, placed on a shelf and incubated at 20°C under continuous illumination of 30 μmol photons m−2 s−1 of cool white fluorescent light. After 1, 10, 20, and 30 min incubation periods, 5- to 10-mL aliquots were removed from each bottle, transferred to 20-mL vials, and then fixed with borate buffered formalin (final conc. = 5%). The fixed samples were stained using DAPI (final conc. = 1 μM) and then filtered onto 5-μm pore-size polycarbonate white membrane filters. The FLB inside a M. rubrum cell were enumerated under an epifluorescence microscope with blue light excitation. The ingestion rates of M. rubrum on FLB were determined, as described above. Additionally, at the beginning of the experiment, a 1-mL fixed aliquot was stained with DAPI and then filtered onto 0.2-μm pore-size polycarbonate black membrane filters. Heterotrophic bacteria (both FLB and non-FLB) outside the M. rubrum cells were also enumerated under an epifluorescence microscope with UV light excitation for non-FLB, and blue light excitation for FLB. After subsampling, the bottles were capped, placed on a shelf, and incubated again, as described above.
Each value of the ingestion rate (IR; cells grazer−1 h−1) was then calculated, as described above.
IR was fitted to a Michaelis-Menten equation and clearance rate was calculated using the equations of Frost (1972) and Heinbokel (1978).
where Imax = the maximum ingestion rate (cells grazer−1 h−1), X = PC (cells mL−1), and KIR = the PC sustaining 1/2 Imax.
RESULTS
Grazing of Mesodinum rubrum, HNFs, and small ciliates on marine heterotrophic bacteria in the coastal waters of Korea
We measured the ingestion rates of natural populations of co-occurring Mesodinium rubrum, HNFs, and small ciliates (<30 μm in cell length) on natural populations of marine heterotrophic bacteria during red tides dominated by M. rubrum in Masan Bay, Keum River Estuary, and the coastal waters of the Saemankeum area in 2006 (Table 2).
During all the field experiments, water temperature ranged from 16.7 to 21.5°C, while salinity ranged from 19.7 to 30.2. In addition, pH ranged from 7.73 to 7.93, while DO ranged from 6.11 to 7.2 mg L−1 (Table 1).
The range of the mean abundances of natural populations of heterotrophic bacteria in diverse Korean coastal waters was from 1.6 × 10⁶ to 14.7 × 10⁶ cells mL−1 (Table 2). The minimum heterotrophic bacterial abundance was observed in Keum River Estuary, while the maximum abundance was observed in Masan Bay. The abundances of co-occurring M. rubrum, HNFs, and small ciliates ranged of 100–16,879, 406–981, and 3.7–26.7 cells mL−1, respectively. The abundance of M. rubrum was varied remarkably at spatiotemporal scales. The maximum abundance of M. rubrum during red tides was greater 195 times than the minimum abundance, while that of HNFs 2.6 times and small ciliates 5.9 times.
During the field experiments M. rubrum, HNFs, and small ciliates were found to ingest FLBs. However, no green inclusion was observed inside protoplasms of M. rubrum cells in the control bottles (without FLBs). The ingestion rates of M. rubrum (2.3–16.8 bacteria grazer−1 h−1) on natural populations of heterotrophic bacteria were comparable to or lower than those of co-occurring HNFs (10.7–41.7 bacteria grazer−1 h−1), but much lower than those of co-occurring small ciliates (76–462 bacteria grazer−1 h−1). Furthermore, the clearance rates of M. rubrum (0.2–10.9 nL grazer−1 h−1) on natural populations of heterotrophic bacteria were comparable to or lower than those of HNFs (1.1–12.2 nL grazer−1 h−1), but much lower than those of small ciliates (9–137 nL grazer−1 h−1). The ingestion and clearance rates of M. rubrum on natural populations of heterotrophic bacteria were significantly lower than those of HNFs and small ciliates (p < 0.01, one-tailed t-test) (Table 2).
The calculated grazing coefficients on natural populations of marine heterotrophic bacteria attributable to M. rubrum, HNFs, and small ciliates were 0.003–0.245 d−1, 0.015–0.204 d−1, and 0.001–0.089 d−1, respectively (Table 2). Thus, the maximum grazing coefficients of M. rubrum on natural populations of heterotrophic bacteria was greater than that of HNFs or small ciliates.
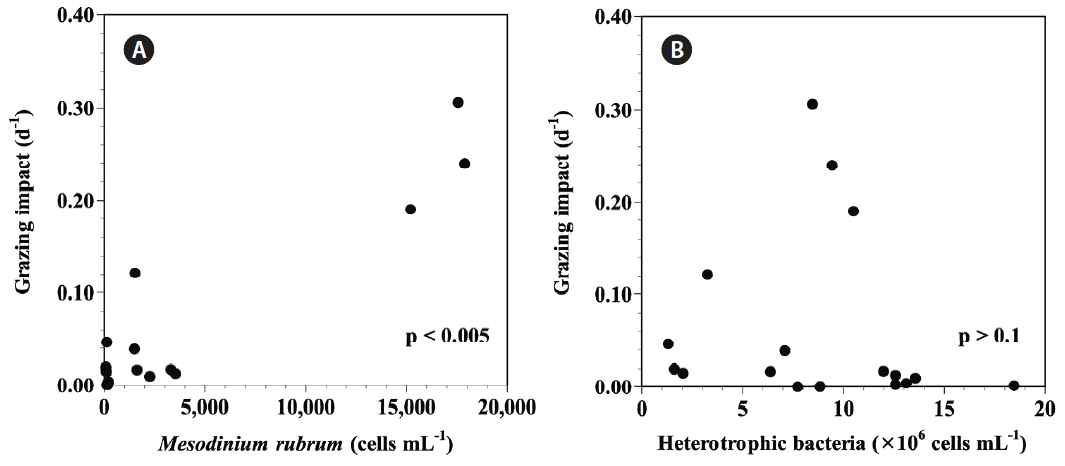
Data from this study show that the grazing impacts by M. rubrum on natural populations of marine heterotrophic bacteria were positively correlated with the abundance of M. rubrum (p < 0.005, linear regression ANOVA) in diverse Korean waters. However, the grazing impacts showed no clear correlation with the abundance of natural population of heterotrophic bacteria (p > 0.1, linear regression ANOVA) (Fig. 2).

Grazing impact by natural populations of Mesodinium rubrum on natural populations of heterotrophic bacteria in diverse Korean coastal waters as a function of M. rubrum abundance (MR) (A) and bacterial concentraion (B). The p-value in panel (A) was p < 0.005, but the p-value in panel (B) was p > 0.1 (linear regression ANOVA).
Prey concentration effects on ingestion rates of Mesodinium rubrum in laboratory
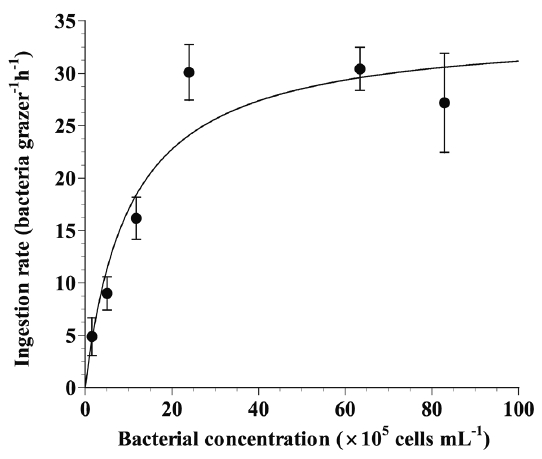
We measured the ingestion rates of M. rubrum as a function of heterotrophic bacterial concentration using FLBs in the laboratory. With increasing initial prey concentration, the ingestion rate of M. rubrum on heterotrophic bacteria rapidly increased at prey concentration of 1–5 × 10⁶ cells mL−1, but became saturated at higher prey concentrations (Fig. 3).

Ingestion rates of the photosynthetic ciliate Mesodinium rubrum on heterotrophic bacteria as a function of prey concentration. Symbols represent mean ± standard error. Ingestion rate (bacterial cells grazer−1 h−1) = 34.4 [x/(1.0 × 106 + x)], r2 = 0.796.
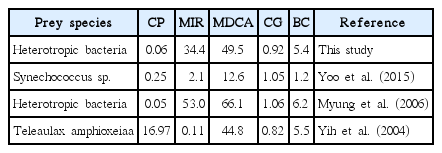
When the data were fitted to Eq. (3), the maximum ingestion and clearance rates of M. rubrum on heterotrophic bacteria were 34.4 bacteria grazer−1 h−1 and 0.04 nL grazer−1 h−1, respectively (Table 3).
DISCUSSION
Grazing impact by the natural populations of Mesodinium rubrum, HNFs, and small ciliates on marine heterotrophic bacteria in the coastal waters of Korea
Simultaneously measured ingestion rates of Mesodinium rubrum, HNFs, and small ciliates on natural populations of marine heterotrophic bacteria during M. rubrum red tides in diverse Korean waters were used to calculate the grazing impacts by each of these three protistan grazer groups. Although there have been many reports about the ingestion rates and grazing impacts of HNFs and small ciliates in the field, to our knowledge, no data regarding these factors is available for M. rubrum populations from natural waters (Epstein 1997, Posch et al. 1999, Boenigk and Novarino 2004, Seong et al. 2006).
The ingestion rates of M. rubrum on natural populations of heterotrophic bacteria were similar to those of red-tide algae Cochlodinium polykrikoides, Heterocapsa rotundata, Heterocapsa triquetra, Heterosigma akashiwo, and Prorocentrum triestinum (2.0–15.3 bacteria grazer1 h−1) (Seong et al. 2006). In addition, the ingestion rates of HNFs and small ciliates on natural populations of heterotrophic bacteria were comparable to those in diverse Koreans coastal waters (in Masan, Jinhae, and Shiwha Bay and Yeosu area) during the period from 2004 to 2005 (Seong et al. 2006).
The combined grazing coefficients of the natural populations of heterotrophic bacteria attributable to M. rubrum, HNFs, and small ciliates ranged from 0.02 to 0.320 d−1 (i.e., 2 to 31% of the natural populations of heterotrophic bacteria were removed by three protistan grazer groups in 1 day) (Table 2). Therefore, M. rubrum, HNFs, and small ciliates may have considerable potential grazing impacts on the populations of heterotrophic bacteria in diverse Korean waters during M. rubrum red-tides; thus, we must consider the grazing by the three protistan grazer groups on heterotrophic bacteria when estimating the total mortality rates of marine heterotrophic bacteria due to grazing.
The orders of grazing impacts on natural heterotrophic bacteria were M. rubrum > HNFs > small ciliates in the coastal waters of the Saemankeum area, HNFs > M. rubrum > small ciliates in Masan Bay, but HNFs > small ciliates > M. rubrum in Keum River Estuary. M. rubrum in the coastal waters of the Saemankeum area could remove the natural populations of heterotrophic bacteria up to 24.1% due to its high concentrations in the field. Thus, the results of the present study suggest that M. rubrum may sometimes have considerable grazing impacts on natural populations of heterotrophic bacteria in Korean coastal waters.
Grazing impact by natural populations of M. rubrum on natural populations of heterotrophic bacteria in diverse Korean coastal waters was significantly positively correlated with the abundance of M. rubrum, but was not correlated with bacterial concentraion (linear regression ANOVA) (Fig. 2). Thus, the grazing impact of M. rubrum on natural populations of heterotrophic bacteria in the field seems to be affected by the grazer abundance, but not by the prey abundance.
Prey concentration and the ingestion rate of Mesodinium rubrum
The maximum mean ingestion rate (MMIR) of M. rubrum on natural populations of heterotrophic bacteria (16.8 bacteria grazer−1 h−1) at the red-tide site were considerably lower than those of M. rubrum on heterotrophic bacteria (34.4 bacteria grazer−1 h−1) measured in the laboratory. The decreased MMIR in the field when compared with laboratory experiments might be caused by feeding competition among multiple natural bacterivores. Second, it could be resulted from the starvation of the M. rubrum strain in the laboratory experiments. Third, such reduction might be originated from the quality difference between the two bacterial populations with one directly from natural seawater while the other one from the enriched culture medium for many generations.
The calculated maximum daily carbon acquisition of M. rubrum from heterotrophic bacteria (5.4–6.2% of its body carbon) is comparable to that from the cryptophyte Teleaulax amphioxeia prey, but greater than that from the cyanobacterium Synechococcus sp. (Table 3). Therefore, heterotrophic bacteria could be an important prey item for M. rubrum in marine environments.
Ecological importance
The results of the present study are ecologically important for better understanding on planktonic food webs in the temperate coastal waters because Mesodinium rubrum was found to sometimes considerably affect the abundance of heterotrophic bacteria in marine environments (Table 2). M. rubrum has been known to feed on diverse prey organisms including cryptophyte, heterotrophic bacteria, and Synechococcus, and in turn is fed by heterotrophic dinoflagellates, ciliates, fish, and shellfish (Kat 1984, Jimenez and Intrigo 1987, Carver et al. 1996, Lee et al. 2014). Therefore, the mixotrophic ciliate M. rubrum could be an important “linking ciliate” between bacteria and higher trophic level organisms in the marine food webs (Myung et al. 2007, Yoo et al. 2015). In addition to the other nutritional strategy such as photosynthesis by kleptoplastids and mixotrophy by feeding cryptophyte cells and cyanobacteria, M. rubrum was found to use heterotrophic bacteria in the natural coastal waters as an alternative source for the essential microelements and cell carbon.
ACKNOWLEDGEMENTS
This paper was supported by the National Research Foundation of Korea (NRF) grants funded by the Korea government (MSIP) (NRF-2015-M1A5A1041808, NRF-2016-R1D1A3B03931620 and NRF-2016-R1C1B1007340) and Management of marine organisms causing ecological disturbance and harmful effect Program of Korea Institute of Marine Science and Technology Promotion (KIMST).


