


Abbreviations
16S rRNA
16S ribosomal RNA
18S rRNA
18S ribosomal RNA
BOLD
Barcode of Life Data System
BSTI
barcode sequences with their respective species-level taxonomic identifiers
COI
cytochrome c oxidase subunit 1
EBS
erroneous barcode sequences
iBOL
the International Barcode of Life database
ITS
internal transcribed spacer
NT
NCBI non-redundant nucleotide sequence database
PR2
the Protist Ribosomal Reference database
rbcL
ribulose bisphosphate carboxylase large chain
INTRODUCTION
Accurate and reliable taxonomic identification is a major cornerstone of evolutionary biology and critical for understanding the diversity of biological life. With the lack of taxonomic expertise, several limitations of extant research, such as phenotypic plasticity, genetic variability, and morphologically cryptic taxa, hinder precise morphological taxonomic identification. Recent technological advances in molecular biology have allowed the development of rapid, robust, and sensitive diagnostic methods for species identification that use standardized DNA regions known as DNA barcodes. Since the inception of DNA barcoding in 2003 (Hebert et al. 2003), over 9,800 peer-reviewed scientific articles containing the terms “DNA barcode” or “DNA barcoding” have been hitherto published. These studies range from taxonomic studies that elucidate cryptic species and phylogenetic relationships to analyses of environmental samples (e.g., soil, marine sediments, and seawater) that include biodiversity monitoring and conservation planning.
Since first proposed by Hebert et al. (2003), the mitochondrial gene encoding cytochrome c oxidase subunit 1 (COI) has been widely used in the identification of species in many groups of animals including birds (Kerr et al. 2007), amphibians (Smith et al. 2008), spiders (Barrett and Hebert 2005), and butterflies (Burns et al. 2008), and several early papers carried out proof-of-concept studies for the utility of the COI barcoding region. Despite the potential power of DNA barcode, several conceptual and methodological limitations still exist regarding the absence of a generally accepted single universal DNA barcode for all organisms (Kress et al. 2015) and DNA amplification bias (Jo et al. 2019).
Once a dataset of DNA barcode sequences is generated from an unidentified specimen, the most common approaches for species discovery and identification are the use of the sequence similarity-based methods, including BLAST search and phylogenetic analysis. To this end, the obtained barcode sequences are first compared to the sequences in the DNA barcode reference databases, such as NCBI GenBank (Sayers et al. 2019), the Barcode of Life Data System (BOLD) (Ratnasingham and Hebert 2007), the Protist Ribosomal Reference database (PR2) (Guillou et al. 2013), and the UNITE database (Koljalg et al. 2005). This implies that the quantity and quality of the barcode data within these databases must be stringently monitored to prevent an adverse impact on species identification accuracy. With the development of high-throughput next-generation sequencing techniques, a noticeably large number of DNA barcode sequences have been produced and stored in online databases, but their degree of validity, accuracy, and reliability have not been extensively and thoroughly investigated (Kim et al. 2019). For example, Bridge et al. (2003) re-evaluated only 206 published DNA barcode sequences for Fungi and revealed that up to 20% of sequences appeared to be misidentified, dubious, or chimeric. Similar validation studies were carried out restrictedly in each bacterial (4,138 16S ribosomal RNA [16S rRNA] sequences) (Ashelford et al. 2005), fungal (51,354 internal transcribed spacer [ITS] sequences) (Nilsson et al. 2006), dipteran (85 COI sequences) (Sonet et al. 2013), and ponyfish (232 COI sequences) (Seah et al. 2017) community.
Thus, in this study, we investigated the amount and types of erroneous barcode sequences (EBS) deposited in publicly accessible databases that are used by molecular taxonomists and geneticists. More than 4.1 million DNA barcode sequences in three large-scale DNA barcode storage databases (NCBI GenBank, BOLD, and PR2) were investigated for four major DNA barcodes (COI, ITS, ribulose bisphosphate carboxylase large chain [rbcL], and 18S rRNA). It was found that approximately 2% of sequences were detected as EBS and, intriguingly, their taxonomic distributions were uneven.
MATERIALS AND METHODS
We used the four most commonly used eukaryotic DNA barcodes including a mitochondrial gene (COI), a chloroplast gene (rbcL), and nuclear ribosomal regions (ITS and 18S rRNA) (Kress et al. 2015). For generating libraries for each barcode sequence, we collected all the sequences that have any given keywords (listed in Supplementary Table S1) in the annotation section of the sequence database record or gene annotation text field. For all four barcode sequences, we used the NCBI non-redundant nucleotide sequence database (NT) that has the most comprehensive set of sequences (approximately 49 million non-redundant sequences and >185 billion base pairs) collected from myriad organisms from all kingdoms. Specifically, for the COI and rbcL barcodes, we further generated corresponding barcode libraries collected from the International Barcode of Life (iBOL) database (http://www.ibol.org) (Ratnasingham and Hebert 2007), representing the largest biodiversity genomics initiative to date. For the 18S rRNA barcode, the PR2 database (https://github.com/vaulot/pr2database) (Guillou et al. 2013) that currently (version 4.11.1) comprises approximately 180,000 ribosomal RNA and DNA sequences and represents most eukaryotic phyla was used.
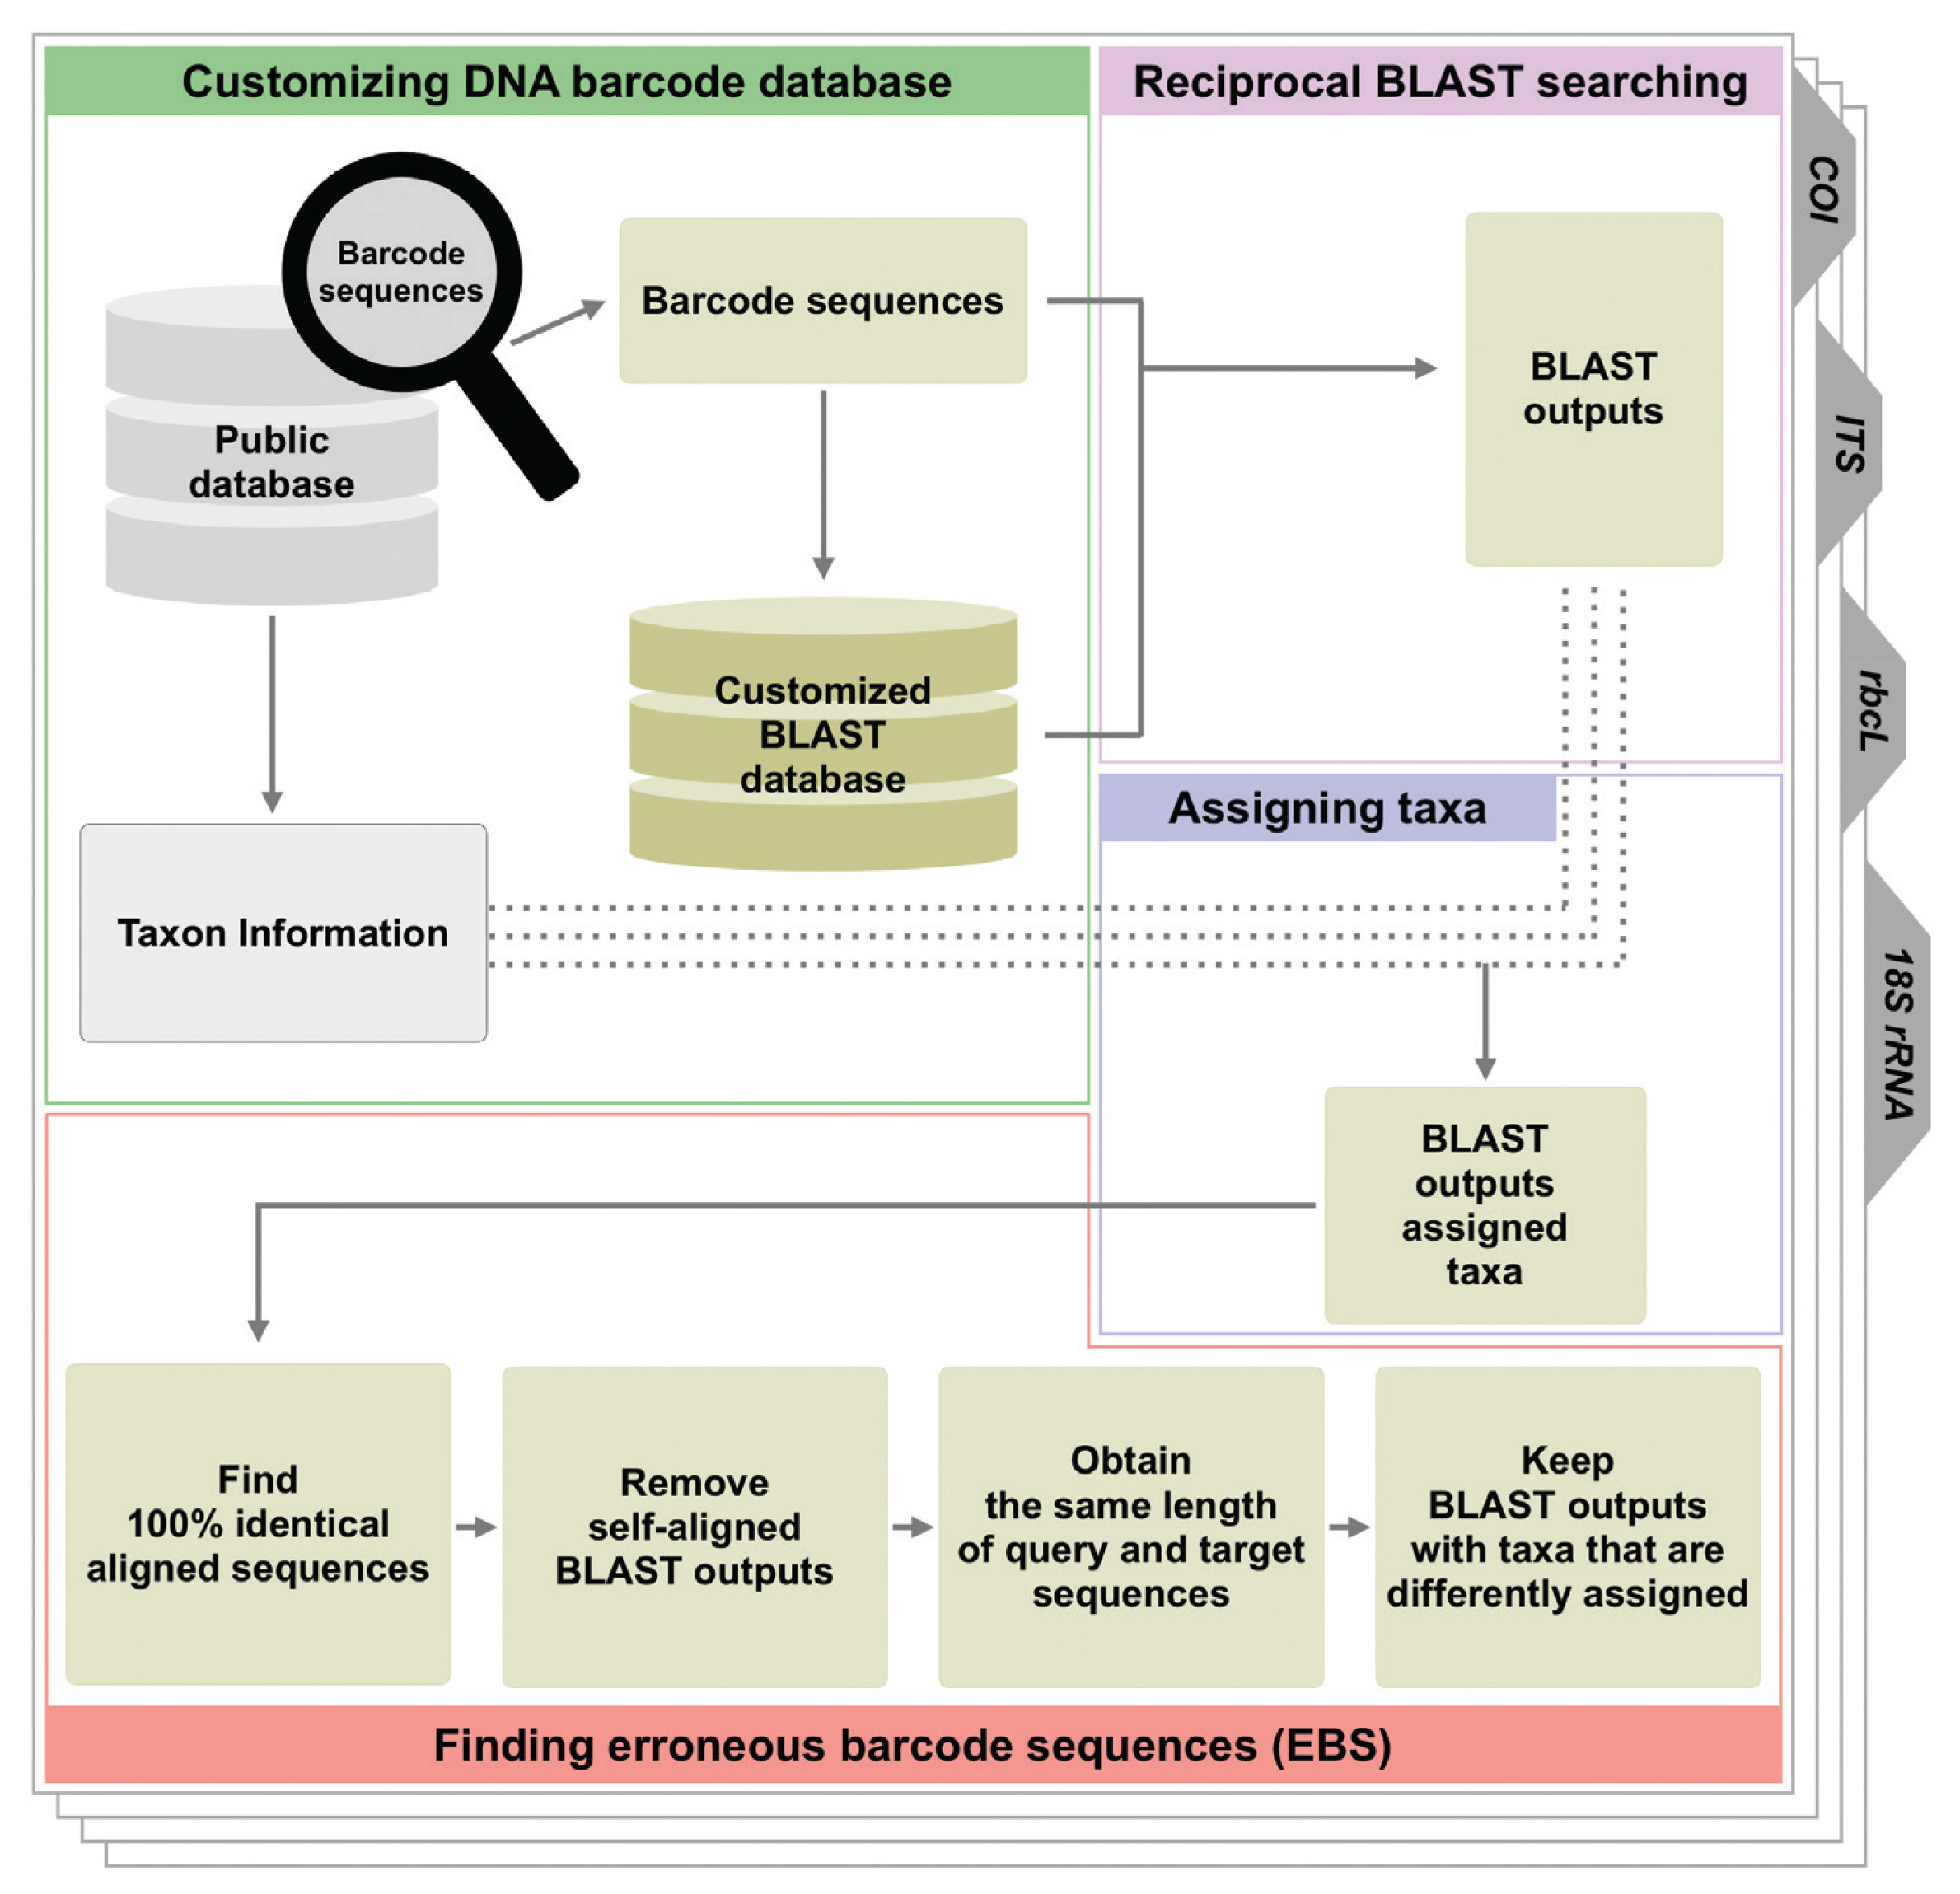
To identify the barcode sequences that are completely identical but with different taxonomic identifiers, hereafter referred to simply as “erroneous barcode sequences” (EBS), we performed the following procedures, illustrated in Fig. 1. Briefly, we first created a BLAST reference database using the COI barcode library and the makeblastdb application from NCBI-BLAST+ (v2.3.0) (Camacho et al. 2009). Next, BLAST was used for each query sequence in the COI barcode library against the target reference database using BLASTN with default parameters. Because the best BLAST hit would usually correspond to the query sequence itself, we further filtered the BLAST output and identified the EBS if the second best hit corresponding to 100% sequence identify (query sequence coverage 100%) had a taxonomic identifier different from that of the query sequence. We repeated these procedures for the remaining barcode libraries (rbcL, ITS, and 18S from NT, COI and rbcL from iBOL, and 18S rRNA from PR2).
RESULTS AND DISCUSSION
From the NCBI NT database, four major DNA barcode sequences including COI, ITS, rbcL, and 18S rRNA were semi-automatically collected using keyword-based search. A total of 834,252 species were identified representing 66,535 genera, 7,289 families, 1,238 orders, 246 classes, and 62 phyla. Specifically, 585,968 species comprising 59.6% of the total barcode sequences were distinguished by the COI barcode and grouped based on phylum, class, and order, such that Arthropoda (78.68%) and Chordata (11.37%) were the major phyla (Supplementary Table S2); Insecta (66.80%) and Arachnida (5.80%) were the major classes (Supplementary Table S3); and Diptera (29.69%), Lepidoptera (11.57%), and Hymenoptera (10.50%) were the major orders (Supplementary Table S4). For the barcode ITS (32.3% of total barcode sequences), 220,527 species from 54 phyla were identified, and Ascomycota (23.90%) and Streptophyta (21.04%) were the major phyla (Supplementary Table S5). As expected, the top 4 classes and top 5 orders belonged to Fungi (Supplementary Tables S6 & S7). For each of the other two barcodes, less than 5% of the total barcode sequences were identified (Supplementary Tables S8–10 for rbcL and Supplementary Tables S11–13 for 18S rRNA).
To demonstrate how many EBS were typically used for barcode-based species identification, all barcode sequences were compared and aligned with each other (see the Materials and Methods section and Fig. 1 for detail). From the approximately 2 million barcode sequences with their respective species-level taxonomic identifiers (hereafter named BSTI), we revealed that approximately 2% were EBS (Table 1). Upon a close examination of the four barcodes (Fig. 2), 6,289 EBS were found in the COI barcode database, which represents 19% of the total EBS and 0.5% (6,289 out of 1,254,703) of the corresponding COI BSTI. The EBS were most dominant in the phylum Arthropoda (52.35%), class Insecta (43.11%), order Lepidoptera (13.66%), family Noctuidae (7.84%), and genus Catocala (5.23%). When classified at the species level, Bombus ardens (101 EBS), Synodontis schall (94 EBS), Thrips flavus (86 EBS), and Junco hyemalis (71 EBS) had more than 1% of the COI EBS. From the ITS barcode database, 12,266 sequences were detected as EBS, and their major taxonomic ranks were mostly from the fungal groups. At the species level, Alternaria tenuissima (5.29% of ITS EBS) and Alternaria alternata (2.88% of ITS EBS) were the major species containing EBS. From the rbcL barcode database, 13,184 EBS representing 40% of the total EBS and more than 10% of the corresponding rbcL BSTI were found. Despite the large numbers of EBS, no dominant species (>1% of rbcL EBS) were observed, but the genus Carex had more than 3% of rbcL EBS. Lastly, we found 1,262 EBS in the 18S rRNA barcode database. Despite the low numbers of EBS, 10 major species (>1% of 18S rRNA EBS) and 7 dominant genera (>3% of 18S rRNA EBS) were observed.
To check whether our findings were not confounded by multiple biases, we performed two sensitivity analyses. First, the length difference between the total barcode sequences and EBS was measured, and no significant differences in length distributions were observed (p > 0.05 with the Kolmogorov-Smirnov test) (Fig. 3). Next, to clarify whether our findings were not confounded due to the ascertainment bias, namely uneven taxonomic distribution of EBS, the number of EBS and non-EBS were compared at each taxonomic level from species to phylum for the four barcode sequences. Except for the Diptera order and Sciaridae family in the COI EBS, all top five taxonomic ranks from species to order in all four barcode sequences had significantly enriched EBS (p < 2.2e-16 with the chi-square test), suggesting partial ascertainment bias. These biases were evident in some taxonomic groups at the phylum and class levels (Fig. 4). Consequently, our finding of the presence of considerable number of EBS is fairly robust and unequivocal.
To increase the available evidence, we extended our findings to two well-curated DNA barcode databases and observed that there were still considerable numbers of EBS in the iBOL and PR2 databases (Table 2).
CONCLUSION
In this study, we identified the EBS that are completely identical but have different taxonomic identifiers and examined the amount and types of EBS that were deposited in publicly accessible databases. A considerable number of EBS were sparsely unequally dispersed throughout major taxa. Surprisingly, EBS were discovered even in the highly curated iBOL and PR2 databases. Because of the incompleteness and inaccuracy of existing DNA barcode databases, molecular taxonomists must exert caution and careful judgment when identifying species, especially when using only DNA barcode sequence data. If ambiguous species identification occurs during DNA barcoding analysis, we advise performing further evaluation with other DNA barcode loci or morphological characters. Finally, we encourage geneticists and molecular taxonomists to reliably generate authoritative DNA barcode libraries, and report or correct any mistakes or errors detected when working with DNA barcode databases.
SUPPLEMENTARY MATERIALS
Supplementary Table S1. Keywords to collect each barcode sequence in the NCBI nucleotide database (https://e-algae.org/).
Supplementary Table S2. Number of COI sequences of each phylum (https://e-algae.org/).
Supplementary Table S3. Number of COI sequences of each class (https://e-algae.org/).
Supplementary Table S4. Number of COI sequences of each order (https://e-algae.org/).
Supplementary Table S5. Number of ITS sequences of each phylum (https://e-algae.org/).
Supplementary Table S6. Number of ITS sequences of each class (https://e-algae.org/).
Supplementary Table S7. Number of ITS sequences of each order (https://e-algae.org/).
Supplementary Table S8. Number of rbcL sequences of each phylum (https://e-algae.org/).
Supplementary Table S9. Number of rbcL sequences of each class (https://e-algae.org/).
Supplementary Table S10. Number of rbcL sequences of each order (https://e-algae.org/).
Supplementary Table S11. Number of 18S rRNA sequences of each phylum (https://e-algae.org/).
Supplementary Table S12. Number of 18S rRNA sequences of each class (https://e-algae.org/).
Supplementary Table S13. Number of 18S rRNA sequences of each order (https://e-algae.org/).