


Abbreviations
COI
cytochrome oxidase subunit I
COI-5P
cytochrome oxidase subunit I DNA barcode region
eDNA
environmental DNA
ITS
internal transcribed spacer
NGS
next-generation sequencing
OTU
operational taxonomic unit
rbcL
ribulose bisphosphate carboxylase large chain
SoEM
Small-organelles enriched metagenomics
tufA
elongation factor Tu-1
INTRODUCTION
Biodiversity has been considered as the integration of biological variability across all scales, from genetic levels, through species and ecosystems, to landscapes (Walker 1992). Raising awareness and maintaining biodiversity is an important goal of conservation biology. However, a fundamental challenge to our understanding of biodiversity is identifying the distribution and abundance of species across space and time (Losos 2010, Lee et al. 2017). Over the past few decades, identification and mapping of biodiversity based on morphological and microscopic approaches has been developed and is being widely used in a variety of studies (Roy and Foote 1997, McManus and Katz 2009). Expert taxonomic knowledge and expensive infrastructure are required to illustrate as many morphological details as possible in a high-throughput manner (Appeltans et al. 2012). However, many morphological characters that define species cannot be clearly distinguished using light or electron microscopy, and an unignorably large number of morphological patterns tend to vary substantially within populations (Scotland et al. 2003). Even if all observable characters for taxonomic identification are available, many ecological assessments by trained taxonomists are misleading due to misidentifications caused by the use of different criteria for species delimitation or different interpretations (Hebert et al. 2004, Fontaneto et al. 2009, Leasi and Todaro 2009).
DNA barcoding, the linkage of a specimen to a unique DNA sequence, has been applied to the taxonomic identification of species (Hebert et al. 2003b, Kress and Erickson 2008, Zhou et al. 2009). The DNA barcode consists of an easily sequenced marker fragment that can distinguish a species based on the principle that genetic variation between species exceeds the variation within them. For example, cytochrome oxidase subunit I (COI) (Hebert et al. 2003b), tufA (Kress et al. 2015), and internal transcribed spacer (ITS) (Eberhardt 2012) have been widely utilized for identifying animals, green algae, and fungi, respectively. While DNA barcodes link an individual to a taxon with similar genetic sequences, DNA metabarcoding or environmental DNA (eDNA) barcoding is an emerging approach to investigate the ecological community structure of mixed samples from a target environment. As next-generation sequencing (NGS) technologies have been developed and successfully exploited to obtain a vast amount of genome sequences at a lower cost (Schuster 2007, Ansorge 2009), DNA metabarcoding relying on the high-throughput sequencing approach (Taberlet et al. 2012) has been popularly utilized in ecological studies. In addition, because NGS-based DNA metabarcoding is undertaken using automated and standardized data processing procedures (e.g., MEGAN4, Mothur, QIIME, and UPARSE pipeline) (Schloss et al. 2009, Caporaso et al. 2010, Huson et al. 2011, Edgar 2013) with well-established and curated databases (e.g., NCBI taxonomy, Federhen 2012; IBOL, http://www.ibolproject.org/; CBOL, Pawlowski et al. 2012; and SILVA, Quast et al. 2013), datasets even from different studies and laboratories can be comparable and will thus facilitate biomonitoring studies with large spatiotemporal resolution (Hajibabaei et al. 2011).
Despite the potential power of DNA metabarcoding for large-scale species identification, several limitations have been pointed out and should be considered (Taberlet et al. 2012). In particular, the main reason of these limitations is a step involving DNA amplification by polymerase chain reaction (PCR). First, the PCR method can introduce errors by degradation of the template DNA or during DNA amplification and sequencing (Cha and Thilly 1993). Second, standardized DNA barcoding markers (e.g., COI, tufA, or ITS) are not necessarily suitable as DNA metabarcoding markers (Elbrecht and Leese 2015). Because the target bulk environmental samples contain organisms from a wide range of lineages, a multi-marker metabarcoding approach is proposed to represent a more accurate method (Drummond et al. 2015). However, it is difficult to determine suitable metabarcoding primer sets for some taxonomic groups such as nematodes that have very divergent mitochondrial genomes (mitogenomes) and ribosomal sequences (Porazinska et al. 2009, Bik et al. 2013). Third, because many variable species have to be amplified in the same PCR experiment, the primers used for amplification must be highly versatile (Elbrecht and Leese 2015). This means that many different target molecules should be amplified with the same efficiency, without missing species containing target sequences that do match well with the primers. However, standardized DNA barcoding primers do not provide equally good matches to all target sequences derived from a bulk environmental sample and thus introduce PCR amplification bias resulting in taxonomic biases (Hebert et al. 2003a, Bellemain et al. 2010, Taberlet et al. 2012, Pawluczyk et al. 2015, Krehenwinkel et al. 2017).
There have been several attempts (e.g., metagenome skimming (Dodsworth 2015, Linard et al. 2015, Greshake et al. 2016), mitochondrial metagenomics (Tang et al. 2014, Crampton-Platt et al. 2015, 2016), a mitochondrial capture microarray (Liu et al. 2016), and mitochondrial enrichment by differential centrifugation (Zhou et al. 2013) to overcome these limitations of using PCR-dependent techniques in ecological research. For example, metagenome skimming, first coined by Straub et al. (2012), is the low-coverage shotgun metagenomics sequencing of bulk DNA from environmental samples. De novo assembly analyses are performed through low-coverage genomic sequencing to provide a high-copy of metabarcoding markers that have been used as phylogenetic markers (e.g., mitochondrial DNA, chloroplast DNA, and rRNA genes) (Andújar et al. 2015, Greshake et al. 2016, Hillmann et al. 2018). The resulting assemblies are assigned for taxonomic identification to any of the genomes in the mixtures. However, details of the recovery of metabarcoding markers from low-coverage genomic sequencing and the accuracy of taxonomic identification from genomic sequence assembly of species mixtures is still vague. Next, the mitochondrial metagenomics approach attempts to capture DNA sequences, especially mitogenomes for species-level diagnosis. Using the de novo genomic assembly method and high-throughput sequencing without DNA enrichment or amplification, the obtained mitogenomes are used for taxonomic identification by comparing sequences in the NCBI database (Tang et al. 2014). However, this method is expensive and a burden on computational resources. Recently, Liu et al. (2016) presented a novel PCR-free mitogenome enrichment pipeline for biodiversity analyses. Using a mitochondrial capture microarray designed with the mitogenome sequences from the 1,000 insect transcriptome evolution project (1KITE, http://www.1kite.org), they demonstrated higher mitochondrial capture enrichment efficiency compared to the PCR-based identification method. Such hybridization-based approaches are high throughput and relatively inexpensive but have some limitations including reliance on the existing knowledge of mitogenome sequences and cross-hybridization problems. Zhou et al. (2013) adopted a differential centrifugation method for mitochondrial enrichment to investigate the biodiversity of Arthropoda. Although this approach proved efficient for fully controlled environmental samples, it has not been applied to actual environmental samples to our knowledge.
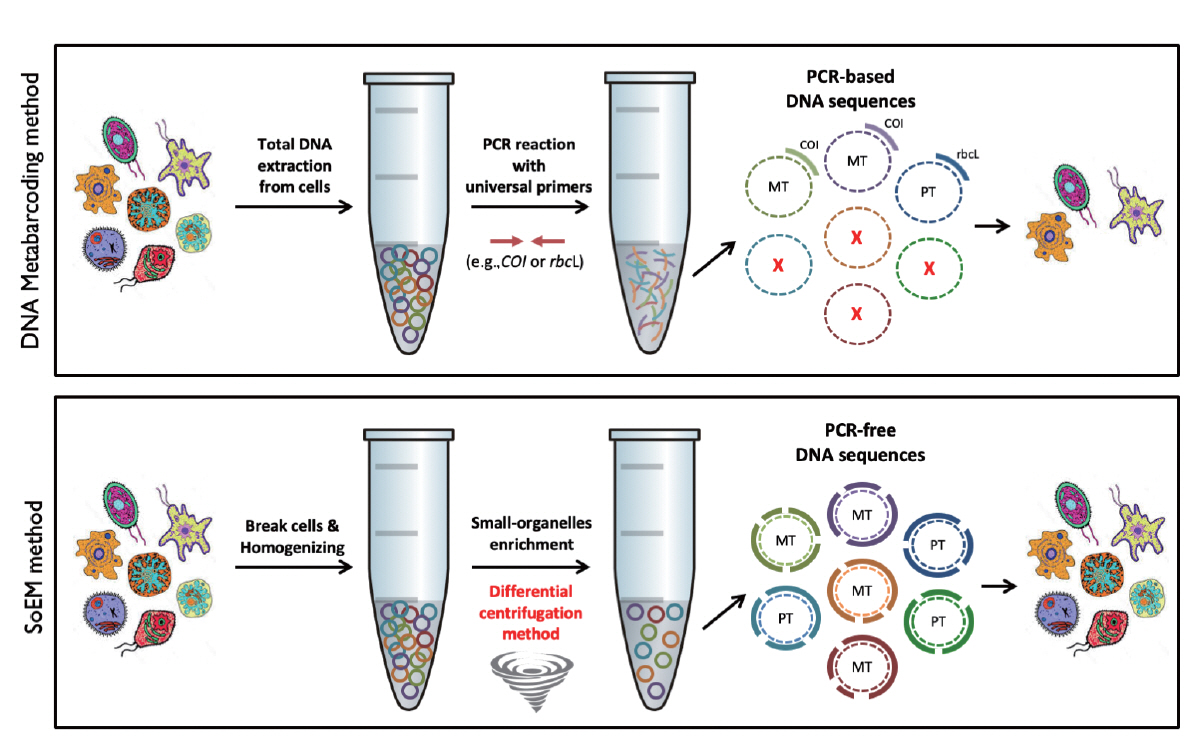
In this study, we present and evaluate the performance of an adapted PCR-free metagenomics method (called small-organelles enriched metagenomics [SoEM]) for biodiversity assessment in actual environmental samples. Without PCR amplification, subcellular fractionation by modified differential centrifugation for complex environmental samples was performed to enrich small organelles including mitochondria and plastids. Using two real marine environmental samples, we tested the taxonomic capture capacity of our SoEM method against the conventional multi-locus DNA metabarcoding method and observed that our SoEM method can detect a broader range of biodiversity compared to the most widely used DNA metabarcoding method.
MATERIALS AND METHODS
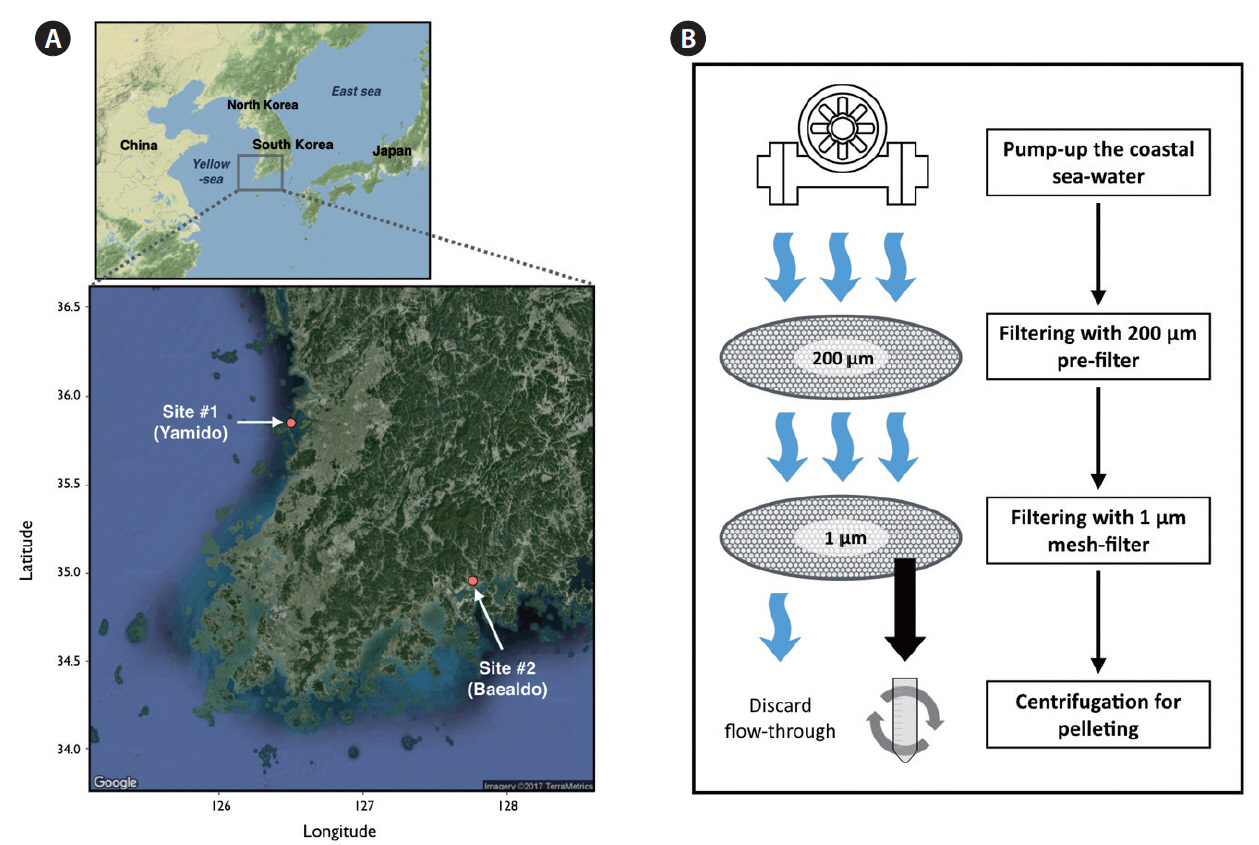
Sample collection
To collect marine micro-eukaryotic environmental samples, coastal seawater from two geologically separated sampling sites in South Korea was pumped using a submersible-pump (with capacity of 69 L min−1). These sites are Yamido, Gunsan-si (35°851′ N, 126°501′ E; site #1) and Baealdo, Gwangyang-si (34°958′ N, 127°763′ E; site #2) (Fig. 1A). The seawater pre-filtered through a 200-μm mesh was concentrated using a homemade-conical shaped filtration unit with a 1-μm mesh filter attached to a 100 mL bottle at the tip. Thus, the environmental samples whose were captured species by this filtration unit included ranging from 1 to 200 μm in size. The concentrated seawater containing the environmental samples was transferred from filtration unit to 50 mL conical tubes, and was finally centrifuged at 2,500 ×g for 20 min to remove seawater (Fig. 1B). About 100 L of seawater was concentrated to one pellet of environmental samples. Above procedures were promptly performed on the sampling site. The pelleted samples were frozen in liquid nitrogen, delivered to the laboratory, and stored at −80°C until DNA extraction.
Small organelles DNA enrichment and extraction
To enrich small organelles including mitochondria and plastids (Fig. 2), we slightly modified the differential centrifugation method described in a previous study (Zhou et al. 2013). About 1 g of frozen filtered sample (corresponding to about 100 L of sea-water) was resuspended in 20 mL of ice-cold homogenizing buffer (250 mM sucrose, 30 mM Tris-HCl, 10 mM EDTA, and pH 7.5). The suspension was homogenized using the IKA-T10 homogenizer (IKA, Staufen, Germany) at the maximum RPM for five cycles of 15 s on and 15 s off on ice. To eliminate the nuclei, cellular debris, and sedimentary pollutants, the homogenate was centrifuged at 1,300 ×g for 10 min, at 4°C. Supernatants enriched in small organelles were transferred to a new-tube and recentrifuged at 4°C at 17,000 ×g for 30 min. Finally, DNA was extracted from the collected pellet using the Qiagen DNeasy Blood/Tissue Kit (Qiagen, Hilden, Germany) following the manufacturer’s protocol, and the purified DNA was stored at −80°C until needed.
eDNA extraction
The eDNA for metabarcoding analysis was extracted using the CTAB protocol (Zhou et al. 1996) with a phenol-chloroform extraction method (Fig. 2). In short, about 1 g of frozen environmental sample was resuspended in 10 mL of 2% CTAB lysis buffer (2% cetyltrimethylammonium bromide, 100 mM Tris-HCl [pH 8.0], 20 mM EDTA, 1.4 M NaCl) and homogenized with the IKA-T10 homogenizer at the maximum RPM for five cycles of 15 s on and 15 s off on ice. The homogenate was treated with 0.5 mL of 20 mg mL−1 proteinase K (Ambion; Thermo Fisher Scientific, Inc., Austin, TX, USA) at 60°C for 1 h, followed by phenol-chloroform extraction and ethanol precipitation of DNA. Finally, precipitated DNA was washed twice with 70% ethanol and was dissolved in TE buffer (10 mM Tris-HCl, 1 mM EDTA, pH 8.0). The eDNA was stored at −80°C until needed.
DNA metabarcoding amplification
Because there is no generally accepted single universal DNA barcode for all organisms, we used four major barcode markers (COI for animal, COI-5P for algae, tufA for green algae, and rbcL for land plants) for DNA metabarcoding in this study (Table 1) (Saunders and McDevit 2012, Kress et al. 2015). The primer-sets were ligated with a pre-adaptor and a primer sequence for amplicon sequencing. The target marker fragments belonging to the barcoding loci were amplified in a 25-μL reaction containing 12.5 μL of KAPA HiFi Hotstart ReadyMix (KAPA Biosystems, Woburn, MA, USA), 5 μL of amplicon primer (1 μM), and 2.5 μL of diluted DNA template (about 5 ng μL−1). The cycling conditions of PCR amplification were one cycle of 94°C for 3 min; 25 cycles of 94°C for 30 s, 55°C for 30 s, and 72°C for 30 s; and a final extension of 72°C for 5 min. The PCR products were purified with AMPure XP beads (Beckman-Coulter, Indianapolis, IN, USA). Index PCR was then performed for the purified PCR products in a 50-μL reaction containing 25 μL of KAPA HiFi Hotstart ReadyMix, 5 μL of NexteraXT Index, 10 μL of sterile deionized water, and 5 μL of PCR product from the previous amplification. Index PCR conditions included one cycle of 95°C for 3 min; 8 cycles of 95°C for 30 s, 55°C for 30 s, and 72°C for 30 s; and a final extension of 72°C for 5 min. The products were purified with AMPure XP beads, and the final purified products were stored at −20°C until required for library preparation. Additional details and primer sequences are summarized in Table 1. The PCR analysis for validation of the enrichment of small-organelles was performed with same condition described above.
Library preparation and sequencing
To construct the sequencing libraries of SoEM assay using the TruSeq Nano DNA kit (Illumina, San Diego, CA, USA), initially about 200 ng of DNA was randomly fragmented for a 550 bp insertion size using a LE220 Focused-ultrasonicator (Covaris, Woburn, MA, USA). The fragmented DNA was blunt-ended and phosphorylated following end repair. The appropriate library size was selected using different ratios of sample purification beads. A single ‘A’ base was ligated to the 3′ end, and Illumina adapters were then ligated to the fragments. The ligated fragments were PCR-amplified and cleaned-up. To verify the size of PCR-enriched fragments of both library types (amplicon and SoEM), the template size distribution was qualified using the Agilent Technologies 2100 Bioanalyzer and 2200 Tapestation (Agilent Technologies, Palo Alto, CA, USA). The final purified products were quantified by qPCR using KAPA Library Quantification kits (KAPA Biosystems) and the LabChip GX HT DNA High Sensitivity Kit (PerkinElmer, Waltham, MA, USA) for Illumina Sequencing platforms following the qPCR Quantification Protocol Guide. Finally, the qualified and quantified library was sequenced with paired-ends (2 × 301 bp) using the Illumina Miseq platform (Illumina). Purification of the PCR product and sequencing reactions were performed by Macrogen Inc. (Seoul, Korea). All the raw sequences obtained in this study were deposited to the NCBI SRA database under accession numbers ranging from SRR8185552 to SRR8185561, and to NCBI Bioproject under the accession number PRJNA505143.
Bioinformatics analysis
To acquire high-quality sequence reads, all raw sequence data from both SoEM and DNA metabarcoding assays were preprocessed using Trimmomatic (v0.35) with a mean Phred score of 15 (Bolger et al. 2014). For preprocessed sequences from the SoEM assay, we applied two approaches to maximize the length of the amplified target sequences. First, the paired reads (i.e., forward and reverse sequences) were stitched together using PEAR (Paired-End reAd mergeR) (v0.9.10) (Zhang et al. 2014) with minimum overlap size ‘-v 10’ and minimum assembly length ‘-n 400’ options. Second, three de novo metagenomic assemblers (SOAPdenovo2, IDBA-UD, and OMEGA) (Luo et al. 2012, Peng et al. 2012, Haider et al. 2014) were used to generate different sets of contigs. The SOAPdenovo2 assembler was run under ‘–k 45, -D, -d, -R, -M 3’ options, and screening of the ‘–K’ option range from 71 to 91. IDBA-UD and Omega assemblers were run using default parameters and corrections of maximum read-length (‘kMaxShortSeqeunce = 565’) and minimum overlap length (‘-l 180’), respectively. For the preprocessed sequences from the DNA metabarcoding assay, we removed the DNA barcoding primer set using Cutadapt v1.16 (Martin 2011) and the forward and reverse sequences from the final clean reads were concatenated using an in-house python script.
Next, to define an operational taxonomic unit (OTU), for merged sequences from the SoEM assay, a BLAST search was performed using each query sequence against the four DNA barcode reference databases (NT, non-redundant nucleotide database; PM, primary-marker sequences from GenBank; MT, mitochondria whole genome database; and PT, plastid whole-genome database) collected and built (Table 2), with an E-value < 1e–10 and aligned length ≥ 400 bp. For the BLAST result of each preprocessed sequence from the DNA metabarcoding assay, the following four steps were performed to eliminate chimeric concatenated reads: (1) accept only sequences belonging to the same target from forward and reverse reads; (2) accept only read pairs having the length of gaps and mismatches ≤5; (3) select one with the longest alignment length if there are many outputs passing the previous two steps; and (4) filtering out the sequences with an abnormal length of the assigned barcode region (i.e., <400 bp or >1,000 bp) because the lengths of the amplified target regions used in this study were estimated to be from 650 to 850 bp (Saunders and McDevit 2012, Kress et al. 2015). The remaining reads were then processed for final taxonomic identification.
To perform taxonomic assignment, we added a taxonomic ID to each OTU using the NCBI file gi_taxid_nucl.dmp(ftp://ftp.ncbi.nih.gov/pub/taxonomy/gi_taxid_nucl.dmp.gz) and an in-house python script. Verification of species names, classification of taxonomic hierarchies, and conversion of scientific to common names was carried out using the ‘taxize’ package in the statistical program R (Chamberlain and Szöcs 2013). Unavailable taxonomic information at each level was represented as ‘N/A’ in further steps. Furthermore, in this study, we excluded all OTUs assigned to the super-kingdoms ‘Bacteria,’ ‘Virus,’ ‘Archaea,’ and ‘Unclassified’ because we assessed micro-eukaryotic biodiversity.
RESULTS AND DISCUSSION
Sampling and high throughput sequencing
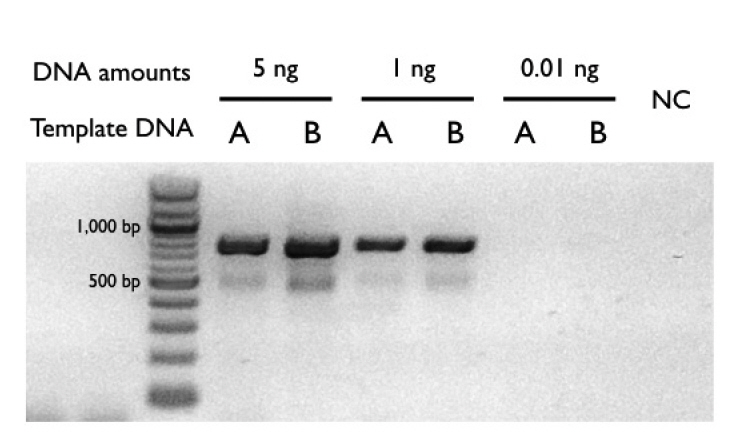
To assess the newly established SoEM method, marine environmental samples from two geologically distinct sites were collected and prefiltered through 200 and 1 μm meshes (Fig. 1). We enriched the small organelles in the environmental samples using the SoEM method (see Materials and Methods for details) (Fig. 2). To validate whether the small organelles were experimentally enriched, we performed PCR amplification of the COI mitochondrial DNA gene (Andújar et al. 2018) in samples before or after differential centrifugation. Our PCR results indicate that the SoEM method can be used effectively to enrich small organelles in environmental samples (Fig. 3). We then performed high-throughput sequencing using an Illumina MiSeq (v2, 301-cycle). After quality filtering, 35.6 and 35.1 million clean reads were generated for site #1 and site #2, respectively (Table 3). The cleaned paired-end reads were merged, and the resultant longer reads (6.92 and 6.65 million for site #1 and site #2, respectively) were used (Table 3). Because many sequence reads were excluded from the preceding analysis (the merging rates of between 37.90% and 38.86%) (Table 3) and to further boost the accuracy of taxonomical classification, we again performed a metagenome assembly using the cleaned paired-end reads to obtain longer contiguous sequences of the genomes of the organisms present in a given eDNA sample. Three different metagenome assemblers were run using multiple parameters (see Materials and Methods for details, Supplementary Table S1). As expected from previous studies (Kunin et al. 2008), longer stretches of contiguous sequences result in the formation of chimeric contigs that contain a mixture of sequences from multiple genomes (Supplementary Table S2); their results were thus excluded from further analysis. To compare whether our SoEM method could provide better performance of taxonomic classification compared to more conventional DNA metabarcoding, we additionally performed amplicon sequencing of four PCR-amplified markers (COI, COI-5P, tufA, and rbcL) using the Illumina Miseq platform. After trimming the adapters and removing PCR primers, 0.49 to 1.10 million clean reads were obtained from site #1 and site #2 (Table 4).
The SoEM method can detect more biodiversity than classical DNA metabarcoding
In this study, we conducted taxonomic assignment using all qualified merged reads (see Materials and Methods for details), which differs from other widely used taxonomic assignment approaches that rely on sequence clustering (Davenport and Tümmler 2013, Nilakanta et al. 2014, Porter and Hajibabaei 2018). These sequence reads were taxonomically assigned via BLAST search using four reference databases (NT, PM, MT, and PT). We then defined a taxonomic class if at least five distinct sequences, hereafter described as one OTU in this study, were classified as the same taxonomic classes. The detailed operation procedures are described in Fig. 4.
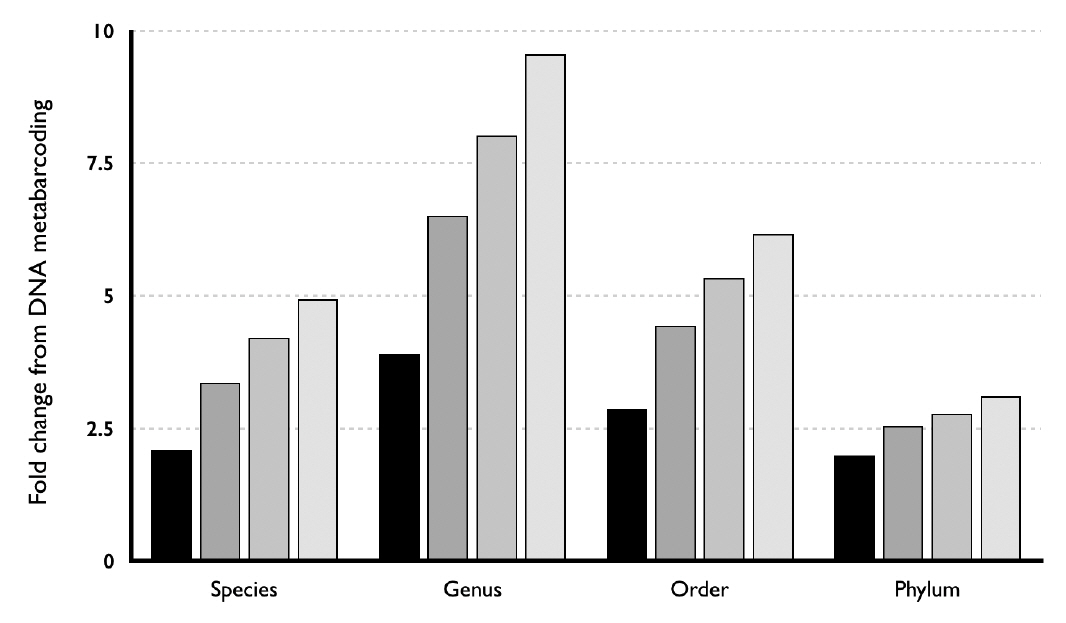
For sampling site #1, a total of 430 SoEM OTUs were classified at genus level, whereas only 45 of the DNA metabarcoding OTUs were classified to this level (Fig. 5). Thus, almost 10-fold greater number of genus groups were identified using our SoEM method. When taxonomic assignment was restricted to a higher level, a 6.17-fold (185 vs. 30) and 3.11-fold (28 vs. 9) greater number of order and phylum groups were assigned, respectively. At the species level, the SoEM method identified 568 species, compared to 115 species identified by DNA metabarcoding. This suggests that our SoEM method detects a broader range of biodiversity compared to the most widely used DNA metabarcoding method.
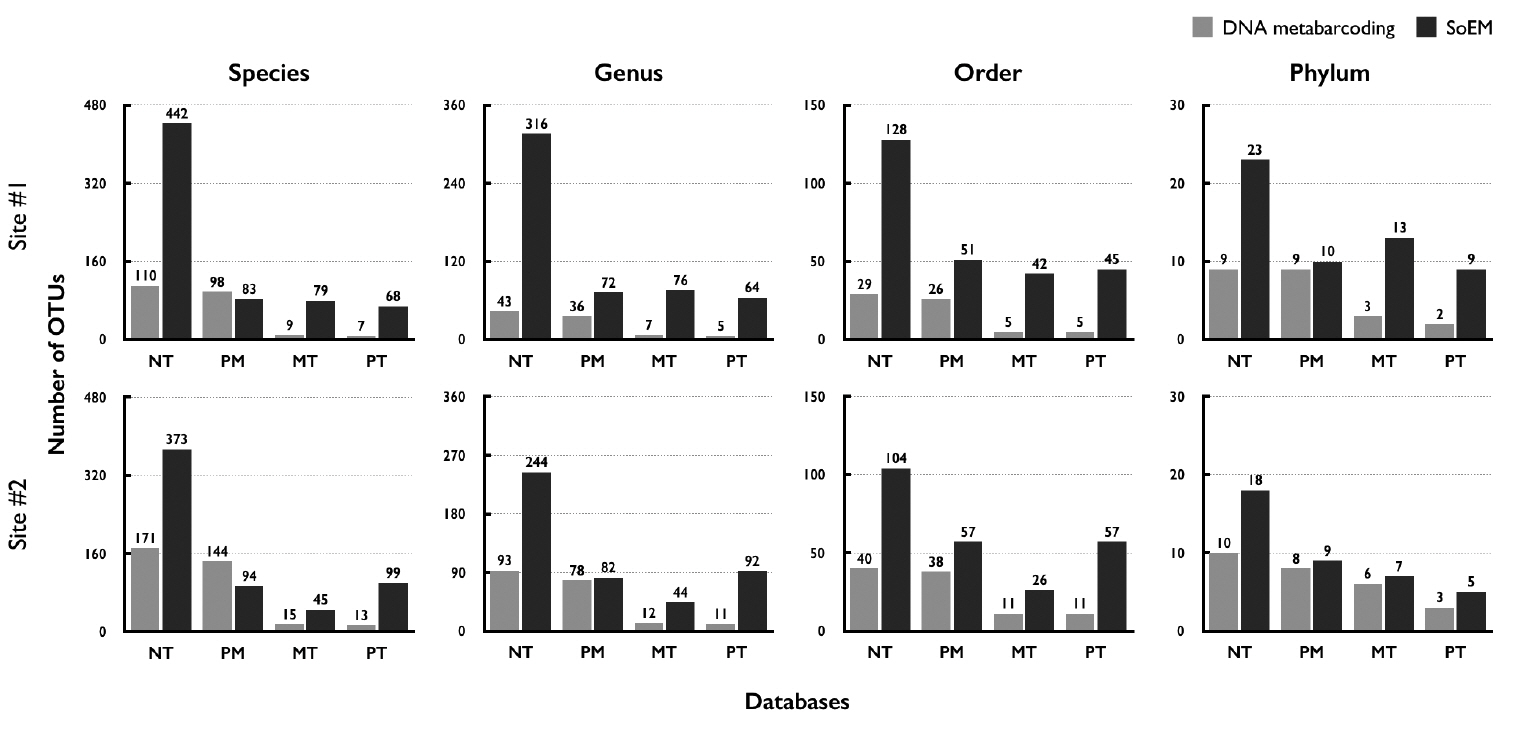
The SoEM method directly sequences small organelle genomic sequences, whereas DNA metabarcoding uses PCR primers to amplify a taxonomically informative marker gene from eDNA mixtures. This means that the quality of taxonomic identification relies on the selected reference databases. Here, we collected and used datasets composed of one all nucleotide collection database (NT), one marker-sequence database (PM), and two genome databases (MT and PT). Because these databases had different areas of interest in taxonomic classification, we repeated the same analysis on each database individually for taxonomic assignment. Except for the result obtained when PM was used for species-level taxonomic classification (83 vs. 98 by SoEM and DNA metabarcoding, respectively), the same trends and slightly different magnitudes were observed (Fig. 6), indicating that the outperformance of the SoEM method was not due to the effect of selecting a particular database. Moreover, OTUs detected from both methods are mainly assigned to marine planktonic phyla such as Rotifera, Arthropoda, Nematoda, Mollusca, and Bacillariophyta. The information of taxon-assigned OTUs is presented in Supplementary Tables S3–S6.
Next, we determined how many taxonomic groups assigned by DNA metabarcoding method could also be identified by the SoEM method to examine the former to be superseded by the latter. At the species and genus levels, more than half of these taxonomic groups were not identified by the SoEM method, whereas this score was decreased in the higher taxonomic levels (Fig. 7). The reason for these results might be that DNA metabarcoding method does not provide an equally sensitive PCR assay for species-level detection to all target sequences derived from eDNA. Further studies are thus required to address this issue.
Our results may have arisen due differences in sequencing depth: we obtained an average 3.44 and 13.58 million-reads in the BLAST search for the DNA metabarcoding and SoEM method, respectively, which indicates about a 4-fold difference. To evaluate this hypothesis, we simulated different coverage depths by randomly sampling the raw sequence reads used for the SoEM method. Three different depths involving two higher coverages (75% and 50% of total SoEM) and one similar coverage (25% of total SoEM) of sequence reads used for DNA metabarcoding method were presented. Following the same experimental approach, we observed that molecular DNA-based identification of taxonomic diversity depends on sequencing depth (Fig. 8). Nevertheless, when directly compared from a sample size perspective (25% of total SoEM), the numbers of detected taxa detected by the SoEM method were still higher (at least 2-fold) in all four taxonomic levels than those detected by DNA metabarcoding method. These findings indicate that our overall results, that the SoEM method detected a broader range of taxa than did DNA metabarcoding method, were not a by-product of the difference in sample size. To validate our method and experimental results, we repeated the same analyses using data from sampling site #2 and observed no significant difference in results.
Caveats
Despite the advantages to SoEM method over DNA metabarcoding method, there are several caveats in our method. First, morphological characteristics of the cells in the sea such as cell-size, shape, hardness, and tissue complexity were highly diverse. For this reason, the disruption efficiency of those cell walls and membranes was not evenly applied to all species in the homogenization process, and this disparity might affect the enrichment of small-organelles from rigid-cells such as diatoms (Kröger and Poulsen 2008). Thus, the experimental process for small-organelle enrichment with environmental samples has room for improvement. Second, the SoEM method required more DNA than the DNA metabarcoding method for successfully preparing the sequencing library. In fact, in our study, the SoEM method required about 200 ng of DNA per library, whereas about 12.5 ng of DNA was required for each library in the DNA metabarcoding method (see Materials and Methods). This difference in the demands for DNA between both methods arises from the fact that the SoEM library intrinsically requires a lot of DNA for whole genome shotgun-sequencing, and the amounts of DNA are inevitably reduced in the experiment of small-organelle enrichment. Thus, more efficient and optimized library preparation strategies are still required for further studies. Third, oceanic plankton communities highly interact with each other in response to changes in environmental conditions (Hays et al. 2005). Symbiotic relationships and prey-predator interactions between microbial eukaryotes and prokaryotes are well known and have been largely studied (Fenchel 1988, Decelle et al. 2012). We only focused on marine microbial eukaryotic ecology, and thus, numerous non-eukaryotic sequences were excluded in our analyses.
CONCLUSION
In this paper, we introduce a newly established PCR-free metagenomics method for marine biodiversity assessment. The SoEM method and its taxonomic capturing capacity were investigated in two marine environmental samples. At least 3-fold higher numbers of taxa were identified in our SoEM method compared to those identified by the conventional multi-locus DNA metabarcoding method. These results are independent of different taxonomic levels (phylum, order, genus, and species). Consequently, our SoEM method is effective and accurate for identifying taxonomic diversity and presents a useful alternative approach to evaluate biodiversity in the marine environment. Although our proposed method is not optimized and still has room for improvement, we suggest that it will be a promising and alternative approach for phylogenetic diversity investigations from various environmental samples and believe that it will be an attractive method for many marine ecologists and conservation biologists.