Identification and characterization of Dunaliella salina OH214 strain newly isolated from a saltpan in Korea
Article information
Abstract
Carotenoids are effective antioxidants that are found in various photosynthetic organisms. Marine microalgae are an advantageous bioresource for carotenoid production because they do not compete with other crops for freshwater and arable land. This study reports a newly isolated Dunaliella strain from the Geumhong Saltpan on Yeongjong Island, West Sea, Korea. The new strain was isolated and classified as Dunaliella salina through phylogenetic analysis and was named the OH214 strain (Deposit ID: KCTC14434BP). The newly isolated strain can survive in a wide range of NaCl concentrations (0.3–5.0 M NaCl), but grows well in 0.6 to 1.5 M NaCl culture medium. Under high-light conditions (500 ± 10 μmol photons m−2 s−1), the cells accumulated three times more β-carotene than under low-light conditions (50 ± 5 μmol photons m−2 s−1). The cells accumulated 2.5-fold more β-carotene under nitrogen-deficient (1 mM KNO3) conditions (3.24 ± 0.36 μg 106 cells−1) than in nitrogen-sufficient conditions (>5 mM KNO3). The lutein content under nitrogen-deficient conditions (1.73 ± 0.09 μg 106 cells−1) was more than 24% higher than that under nitrogen-sufficient conditions. Under the optimized culture condition for carotenoid induction using natural seawater, D. salina OH214 strain produced 7.97 ± 0.09 mg g DCW−1 of β-carotene and 4.65 ± 0.18 mg g DCW−1 of lutein, respectively. We propose that this new microalga is a promising strain for the simultaneous production of β-carotene and lutein.
INTRODUCTION
Carotenoids are an abundant pigment group found in photosynthetic organisms and serve light-harvesting and photo-protection functions (Frank and Cogdell 1996). Owing to their antioxidative activity, several carotenoids are used as food additives, health supplements, and medicines (Stahl and Sies 2003). For example, β-carotene is a source of provitamin A along with α-carotene and β-cryptoxanthin (Edge et al. 1997), and lutein, which is found in high concentrations in the human eye and reduces the probability of macular degeneration by protecting the eyes from photo-oxidative damage (Carpentier et al. 2009, Bernstein et al. 2016). These pigments are not naturally synthesized in the human system; therefore, they should be obtained through the diet (Sommerburg et al. 1998). Although β-carotene and lutein can be easily found in a variety of green vegetables, it is difficult to consume them sufficiently because of their low content (Sommerburg et al. 1998, de Sá and Rodriguez-Amaya 2003). Thus, it is recommended that these compounds be replenished through the uptake of health supplements. With increasing demand, it was forecasted in 2016 that the global market size of β-carotene and lutein have expanded to 246.2 million USD (17% of the total carotenoid market) and 225 million USD (15.6% of the total carotenoid market), respectively (Bogacz-Radomska et al. 2020).
Most of the natural β-carotene production has been achieved from Dunaliella salina, which is a microalga accumulating massive amounts of β-carotene (over 5% in biomass) under environmental stresses such as high salinity, and high temperature, high-light intensity, and nutrient starvation (Mil’ko 1963, Ben-Amotz et al. 1991, Ribeiro et al. 2011, Xu et al. 2018). On the other hand, lutein is mainly produced from marigold flowers, and it is possible to produce a maximal 27.9 mg g DW−1 of lutein using optimized extraction and purification techniques (Delgado-Vargas and Paredes-López 1996, Fernández-Sevilla et al. 2010). Nevertheless, the use of marigold flowers has several limitations to the production of lutein, such as the optimum period for harvesting, a complicated process for purification of lutein from the extract, and competition with other crops for arable land and water (Delgado-Vargas and Paredes-López 1996, Lin et al. 2015). In contrast to marigold flowers, microalgae can be cultivated all year-round and require relatively little labor (Fernández-Sevilla et al. 2010). In addition, pigment extraction from microalgae is much easier and simpler than that from marigold flowers (Becerra et al. 2020). In addition, competition with crops does not occur because cultivation of microalgae is possible in non-arable land such as coastal areas or deserts (Williams and Laurens 2010). Considering these issues, β-carotene and lutein production from microalgae is expected to have high productivity and efficiency in the use of resources.
Many efforts have been made to produce β-carotene or lutein from microalgae (Ben-Amotz et al. 1991, Lin et al. 2015, Sun et al. 2015). Dunaliella species are a group of green algae that can survive at various salinities (0.5–5.0 M NaCl) (Chen and Jiang 2009, Little et al. 2021) and are found in a wide range of saline-environmental conditions from coastal regions to high-salinity regions (Borowitzka and Siva 2007). Therefore, Dunaliella species are advantageous for large-scale cultivation in outdoor ponds because they can induce pigment accumulation while being resilient to increases in salinity due to evaporation (Ben-Amotz et al. 1991). On the other hand, several freshwater microalgae, such as Chlorella species (Shi et al. 2002), Scenedesmus species (Ho et al. 2014), and Desmodesmus species (Xie et al. 2019), have been investigated for lutein production.
In this study, we identified a newly isolated Dunaliella strain from a high-salinity pond (>5.0 M NaCl) of the Geumhong saltpan on Yeongjong Island, West Sea, South Korea. Physiological characteristics of the strain under various salinity, light, and nitrogen concentrations were investigated for carotenoid production, particularly for β-carotene and lutein. Moreover, the potential of the new Dunaliella strain for β-carotene and lutein production is discussed in comparison with previous producers.
MATERIALS AND METHODS
Sample collection and single-colony isolation
Samples were collected from the brine water stored in the Geumhong Saltpan (37°28′23.8″ N, 126°31′33.2″ E) on Yeongjong Island in the West Sea of Korea in February 2020. The mixed sample was diluted serially and cultured on a solid plate in Dunaliella culture medium (D. medium, 1% agarose) containing 3.0 M NaCl, and a single colony was isolated.
Culture medium and culture conditions
The standard Dunaliella culture medium contained the following ingredients (Kim et al. 2017): 40 mM Tris-HCl (pH 7.4), 5 mM KNO3, 4.5 mM MgCl2, 0.5 mM MgSO4, 0.3 mM CaCl2, 0.1 mM K2HPO4, 2 μM FeCl3, 20 μM Na-EDTA, 50 μM H3BO3, 10 μM MnCl2, 0.8 μM ZnSO4, 0.4 μM CuSO4, 2 μM Na2MoO4, 1.5 μM NaVO3, and 0.2 μM CoCl2. Additionally, 25 mM NaHCO3 was added as the inorganic carbon source. Three concentrations of NaCl (0.6, 1.5, and 3.0 M) were used in the experiments. Three concentrations of KNO3 (1, 5, and 10 mM) were used for the experiments under nitrogen supply conditions.
To maintain seed culture, cells were cultured in 200 mL of D. medium in 500 mL flasks, with orbital shaking (100 rpm) at 50 ± 5 μmol photons m−2 s−1 of continuous light. For salinity experiment, the cells were used after two weeks of adaptation in the D. medium with 0.6, 1.5, or 3.0 M NaCl, respectively. For the nitrate concentration experiment, the cells were used after two weeks of adaptation in 0.6 M NaCl D. medium containing 1, 5 (control), or 10 mM KNO3. In NaCl and KNO3 experiments, the light condition and temperature were maintained to 50 ± 5 μmol photons m−2 s−1 of continuous light and 25 ± 1°C, respectively. For high-light irradiation, the cells were cultured in 0.6 M NaCl D. medium with 5 mM KNO3 and exposed to 500 ± 10 μmol photons m−2 s−1 of continuous light at a mid-exponential phase.
Phylogenetic analysis
Genomic DNA was extracted using the CTAB method (Fawley and Fawley 2004). 100 ng of genomic DNA was used to amplify the partial sequence including 18S ribosomal RNA (18S rRNA) and internal transcribed spacer (ITS). The sequences of primers were as follows: forward primer of 18S rRNA (5′-GTCAGAGGTGAAATTCTTGGATTTA-3′), reverse primer of 18S rRNA (5′-AGGGCAGGGACGTAATCAACG-3′), forward primer of ITS (5′-TCCGTAGGTGAACCTGCGG-3′), and reverse primer of ITS (5′-TCCTCCGCTTATTGATATGC-3′). The 18S rRNA sequence of the OH214 strain was deposited to NCBI (accession number: OK161018) and the partial ITS sequence of the OH214 strain was displayed in Supplementary Fig. S1. The sequences were analyzed using the Neighbor-Joining algorithm (Saitou and Nei 1987) and the Jukes-Cantor distance model in Geneious R11. Values at branching points represent consensus support (%) in 5,000 bootstrap replicates (Felsenstein 1985). The 18S rRNA and ITS sequences used in the analyses are listed in Supplementary Tables S1 and S2, respectively.
Cytological analysis
Ten microliters of cell culture were dropped on a glass slide and covered with a coverslip. Images of the cells were captured using a Nikon Eclipse Ni fluorescence microscope (Nikon, Tokyo, Japan). The cell size, cell width, cell length, and flagella length were manually measured using the selection tool of the annotations and measurements toolkit included in the analyzing program, ‘NIS-Elements BR’. More than 50 randomly selected cells were analyzed for statistical analysis.
Specific growth rate and biomass
The specific growth rate (μ) was calculated from the measured cell density during the exponential phase using the following equation:
, where D2 and D1 represent cell density (×104 cells mL−1) at times t2 and t1, respectively (Levasseur et al. 1993). Biomass was quantified using cell density. The cell density was measured by direct cell counting using a hemocytometer (Marienfeld-Superior, Lauda-Königshofen, Germany) in the 25 central squares of the chamber. Dry weight was measured according to the method described in a previous paper (Kim et al. 2017); 50 mL of cell culture was harvested by centrifugation at 1,500 ×g for 10 min at 20°C. To remove cell debris, the supernatant (medium) was carefully discarded, and the pellets were washed once with wash buffer containing 0.3 M NaCl. The cells were re-suspended and transferred to a pre-weighed 50 mL Falcon tube (A). The cells were harvested by centrifugation at 1,500 g for 5 min at 20°C, and the supernatant was completely removed. After drying for 48 h at 65°C, the tubes were re-weighed (B). The net dry weight was calculated as “(B) – (A).”
Quantification of carotenoids
Cell culture (0.5 mL) was harvested by centrifugation (20,000 ×g, 2 min), and the supernatant was discarded. Pigments were extracted from the pellet into 0.5 mL of 90% (w/w) acetone for 1 min. After centrifugation at 20,000 g for 5 min, the supernatant was filtered through a 0.2 μm nylon filter. The filtrate was analyzed on a Shimadzu Prominence high-performance liquid chromatography (HPLC) system (model LC-20AD; Shimadzu, Kyoto, Japan), equipped with a Waters Spherisorb S5 ODS2 cartridge column (4.6 × 250 mm) (Waters, Milford, MA, USA). HPLC analysis was performed according to the methods described by Polle et al. (2001). Quantification and identification were conducted based on the retention time and absorption spectra with reference to pigment standards (DHI 14C Centralen; DHI, Hørsholm, Denmark).
RESULTS AND DISCUSSION
Isolation of the OH214 strain
In February 2020, marine microalgae were collected from the red-colored pond of the Geumhong Saltpan (37°28′23.8″ N, 126°31′33.2″ E) on Yeongjong Island, in the West Sea of Korea (Fig. 1). The pond was covered with a roof so as not to be affected by rainfall (Fig. 1D). The temperature and pH of the saltpan water were approximately 4°C and pH 7.4, respectively. Additionally, considering the amount of salt crystals, it was expected that the NaCl concentration would exceed 5.0 M, which is the maximum concentration at the time of dissolution. If so, the salinity of saltpan water is 8-fold higher than that of natural seawater (0.581 M NaCl) (Kim et al. 2017).

Sampling site of Dunaliella salina OH214. (A) The location of Yeongjong Island on the West Sea of Korean peninsula (red box). (B) The location of the Geumhong Saltpan (red box, 37°28′23.8″ N, 126°31′33.2″ E) on Yeongjong Island. (C) The site view of Geumhong Saltpan. (D) Storage pond of brine water. The pond was covered with a roof.
From microscopic observation, we confirmed that several microalgal species were observed, such as orange / brown-colored cells, green cells, and even diatoms. The red color of the saltpan may be related to carotenoid accumulation in certain microorganisms. Thus, the mixed sample was spread on 3.0 M D. medium containing antibiotics (25 μg mL−1 of kanamycin and 50 μg mL−1 of ampicillin) to isolate only microalgal species, excluding bacteria. As it is well known that carotenogenic Dunaliella cells turn their color to orange / brown under high-light stress (Borowitzka and Siva 2007, Jin and Polle 2019), the culture plates were exposed to 800 ± 50 μmol photons m−2 s−1 in a 25 ± 1°C culture room. After two weeks, orange / brown colonies were observed, which were transferred to liquid D. medium containing 1.5 M NaCl (Supplementary Fig. S2). The cleaned and isolated strain were cultured at 50 μmol photons m−2 s−1 in a 25 ± 1°C culture room. This isolated strain, designated OH214, consists of two flagella and has an ellipsoidal cell shape (Table 1).

Cytological characteristics of Dunaliella salina OH214 strain
Identification of OH214 strain based on phylogenetic analysis
We conducted phylogenetic analysis using partial sequences of 18S rRNA and ITS. Phylogenetic analysis of 18S rRNA sequences of various green microalgae, including the OH214 strain (marked by a black box, labelled Dunaliella salina KCTC14434BP), revealed that the newly isolated OH214 strain belonged to the Dunaliella genus of Chlorophyta (Fig. 2A). Phylogenetic analysis using the ITS sequence, which is widely used to determine Dunaliella species (González et al. 1998, Emami et al. 2015), also show that the OH214 strain was grouped with Dunaliella species, which is known to be a carotenogenic species (Fig. 2B). The OH214 strain was phylogenetically close to the D. salina CCAP19/18 strain and the D. salina UTEX LB2538 strain (formerly name D. bardawil UTEX2538), which is a representative Dunaliella strain for β-carotene production (Borowitzka and Siva 2007, Xu et al. 2018). A difference in the three nucleotide bases between their ITS sequences compared to the OH214 strain and MBTD-CMFRI-S135 strains (Supplementary Fig. S3) reveal that the OH214 strain is new. After genetic identification, the D. salina OH214 strain was deposited and received a deposit ID (Dunaliella salina KCTC14434BP) from the Korean Collection for Type Cultures (KCTC), the microbial bank of Korea.

Phylogenetic analysis of Dunaliella OH214 strain. (A) Phylogenetic tree based on 18S ribosomal RNA (18S rRNA) sequences. (B) Phylogenetic tree based on internal transcribed spacer (ITS) sequences. The OH214 strain (Dunaliella salina KCTC14434BP) is marked with a black box. Orange and green circles indicate carotenogenic and non-carotenogenic strains, respectively. The distinction between carotenogenic and noncarotenogenic strains was indicated with reference to the review paper (Borowitzka and Siva 2007). Phylogenetic analysis was conducted with the Neighbor-Joining algorithm and Jukes-Cantor distance model in Geneious R11. Values at branching points represented consensus support (%) in 5,000 bootstrap replicates. The 18S rRNA and ITS sequences used in the analyses are detailed in Supplementary Tables S1 and S2, respectively.
Characteristics of the OH214 strain to salinity
Dunaliella species can survive under various salt conditions because of their osmotic regulatory mechanisms (Chen and Jiang 2009). In addition, the quantity of lipids or pigments in cells can change according to salinity. Here, we considered the cell growth rate as a standard to determine the optimal salinity.
The salinity of the Geumhong Saltpan was expected to exceed 5.0 M of NaCl; however, this concentration makes it difficult to maintain stable culture condition due to naturally formed salts during culture. Therefore, we investigated the physiological characteristics of the OH214 strain growing at 0.6, 1.5, and 3.0 M NaCl. In previous studies, the various metabolic pathways in Dunaliella species were easily affected by osmotic stress (Chen and Jiang 2009, Lv et al. 2021). To ensure long-term osmotic stress, the cells were completely adapted for two weeks under each salinity condition. The same number of cells (25 × 104 cells mL−1) were then inoculated and cultured under 50 ± 5 μmol photons m−2 s−1 of continuous light at 25 ± 1°C (Fig. 3A).

Physiological characteristics of Dunaliella salina OH214 strain grown at various NaCl concentrations. (A) Flask images. (B) Cell images on the exponential and stationary phase. (C) The size distribution of cell populations on the exponential and stationary phase. The box-plot indicates the average size of cell populations (n > 50). (D) Cell growth patterns. (E) Lutein and β-carotene contents on the exponential and stationary phases (per cell number). Based on the growth patterns, the exponential and stationary phases were determined; exponential phase (day 3 for 0.6 and 1.5 M cultures, day 4 for 3.0 M sample) and stationary phase (day 6 for 0.6 and 1.5 M cultures, day 7 for 3.0 M cultures). All experiments were conducted in triplicate. Statistical analysis was performed using Student’s t-test (a,bp < 0.05); avs. 0.6 M; bvs. 1.5 M. Scale bars represent: B, 10 μm.
The microscopic images of the OH214 strain showed that the cell grown in a high salinity was bigger than those grown in lower salinity (Fig. 3B). For 7-d of cultures, cell sizes in the 3.0 M NaCl medium were 35–40% larger than in the 0.6 M NaCl medium and 26–29% larger than in the 1.5 M NaCl medium (Fig. 3C). The average width and length of cells varied with salinity (Borowitzka and Siva 2007). However, the width and length of OH214 strain were observed to be 10.3–10.6 and 16.8–19.5 μm, respectively (Table 1). For the growth patterns, the cells in 0.6 and 1.5 M NaCl exhibited an exponential phase on day 3 and a stationary phase on day 6, but the cells in 3.0 M NaCl showed an exponential and a stationary phase on days 4 and 7, respectively (Fig. 3D). The growth rates (μ) calculated at the exponential phase were high in 0.6 M (0.51 ± 0.04 d−1), 1.5 M (0.46 ± 0.01 d−1), and 3.0 M NaCl (0.24 ± 0.02 d−1). Similar to the cases of many microalgae (Uriarte et al. 1993), the growth rate was inversely correlated with cell size. Based on the cell growth rate, our results indicated that the optimal salinity of the D. salina OH214 strain was 0.6 M NaCl.
The carotenogenic Dunaliella cells in high-salinity conditions accumulate more β-carotene than those in lower salinity conditions (Borowitzka et al. 1990, Park et al. 2015). Based on these results, the D. salina OH214 strain was classified as a carotenogenic strain, and it was expected that the OH214 strain would accumulate carotenoids under high-salinity conditions. Therefore, we compared the pigment content of cells in the exponential and stationary phases at different salinities. The β-carotene and lutein content of cells cultured in a 3.0 M medium was higher than that in other conditions (Table 2, Fig. 3E). However, the cell color of the D. salina OH214 strain did not change to orange / brown during the culture period.

Carotenoid contents according to salinity
Because the cost of cultivation using natural seawater might be relatively lower than the cost of the addition of NaCl to artificial seawater, the application of natural seawater could avoid competition with agricultures and industries that use freshwater (Kim et al. 2017). Therefore, 0.6 M NaCl, which is close to the salinity of natural seawater (0.581 M NaCl), was selected as an optimal salinity of the culture medium.
Characteristics of the OH214 strain under light intensity
During the isolation of single cells, it was confirmed that the color of D. salina OH214 colony turned orange / brown under high-light conditions (Supplementary Fig. S2). Thus, we investigated the effects of high-light on the OH214 strain. The same number of cells (25 × 104 cells mL−1) were inoculated and cultured under 50 ± 5 μmol photons m−2 s−1 of continuous light at 25 ± 1°C. Three days after inoculation (mid-exponential phase), the flasks in the high-light group were transferred to 500 ± 10 μmol photons m−2 s−1 of continuous light.
Four days after the light shift, the flask exposed to 500 ± 10 μmol photons m−2 s−1 was markedly brown (Fig. 4A). However, a difference in cell color was observed even from day 2 after the light shift from the microscopic image (Fig. 4B). For the growth patterns, the cell density of the high-light grown was 18–30% higher than that of the control condition (Fig. 4C). The carotenoid composition of the D. salina OH214 strain was distinctly charged after high-light treatment (Fig. 4D), which is similar to that observed for other cartenogenic Dunaliella strains (Shaish et al. 1993, Lamers et al. 2010, Xu et al. 2018), α-carotene and β-carotene increased to 3.24 ± 0.36 μg 106 cells−1, by more than 2.5-fold compared to the control group (Table 3). On the other hand, lutein content under the high-light conditions was reduced by 19–27% compared to the highest content in low-light conditions (1.82 ± 0.04 μg 106 cells−1). When D. salina HG-01 strain was exposed, the lutein content of D. salina HG-01 strain was reduced by 75% at 1,500 μmol photons m−2 s−1 compared to 150 μmol photons m−2 s−1 (Li et al. 2019). These results indicate that high light is suitable for inducing β-carotene content but reduces lutein content.

Physiological changes of Dunaliella salina OH214 strain after shifting from low light to high light. (A) Flask images. (B) Cell images. (C) Cell growth patterns. The control group did not change the light condition (low light), but the experimental group shifted the light condition to high light on the third day. (D) Lutein and β-carotene contents (per cell number). The salinity of the culture medium was 0.6 M NaCl. The light intensities at low light and high light were 50 ± 5 μmol photons m−2 s−1 and 500 ± 10 μmol photons m−2 s−1 of continuous light. All experiments were conducted in triplicate. Statistical analysis was performed using Student’s t-test; *p < 0.05. Scale bars represent: B, 10 μm.

Carotenoid contents according to light intensity
Characteristics of the OH214 strain under nitrogen supply
Nitrogen concentration is an important factor that regulates biomass or carotenoid productivity in microalgae (Jo et al. 2020, Minyuk et al. 2020). Because nitrogen is a major component of proteins, nitrogen-deficient conditions cause retardation or terminate cell growth and trigger the accumulation of secondary metabolites (Yaakob et al. 2021). In Dunaliella species, nitrogen starvation has been widely employed to increase β-carotene content (Ben-Amotz 1987, Lamers et al. 2012). In a previous study, it was confirmed that Dunaliella grows well not only at 5 or 10 mM but also at lower nitrogen concentrations (0.75 or 1 mM) (Borowitzka 1991, 1995). Thus, it is necessary to optimize the nitrogen supply, depending on the species, to increase biomass or pigment production.
To determine the optimal conditions for β-carotene and lutein production, we investigated the effect of nitrogen concentration on the newly isolated D. salina OH214 strain. Because the standard culture medium included 5 mM KNO3 as a nitrogen supply, we tested the effect of lower and higher concentrations than that of standard nitrate on β-carotene and lutein contents. For nitrogen-deficient and nitrogen-sufficient conditions, 1 mM and 10 mM KNO3 were chosen for the study. The cells were completely adapted to the culture medium with different nitrate concentrations for more than two weeks, and then the same number of cells (25 × 104 cells mL−1) were inoculated and cultured under 50 ± 5 μmol photons m−2 s−1 of continuous light at 25 ± 1°C.
Unlike the standard and nitrogen-sufficient cultures, the nitrogen-deficient culture started to turn brown 6 d after inoculation (Fig. 5A). The maximal cell density in nitrogen-deficient culture was approximately 13 and 27% lower than that of standard and nitrogen-sufficient cultures, respectively (Fig. 5B). When the cell morphology of the stationary phase was compared using a light microscope, the cells in the nitrogen-deficient culture showed a yellowish color compared to the cells in the standard and nitrogen-sufficient cultures (Fig. 5C). The contents of β-carotene and lutein differed according to the different nitrate concentrations in the culture medium (Table 4, Fig. 5D). In the stationary phase, the β-carotene and lutein contents basis on the cell number were not notably different between standard and nitrogen-sufficient cultures but were lower than that of nitrogen-deficient culture. The highest β-carotene content was observed in a nitrogen-deficient culture (1.95 ± 0.34 μg 106 cells−1), which is 2.5-fold higher than that of standard and nitrogen-sufficient cultures. In addition, the highest lutein content was 1.73 ± 0.09 μg 106 cells−1 in nitrogen-deficient culture, which is 24 and 31% higher than that of standard and nitrogen-sufficient cultures, respectively. However, the amount of biomass production between the nitrogen-deficient and standard cultures was not notably different (Fig. 5E). Therefore, the high carotenoid content per cell number in nitrogen-deficient culture can be explained by the enlarged cell size due to the inhibition of cell division (Jo et al. 2020, Minyuk et al. 2020, Yaakob et al. 2021). These results indicate that nitrogen shortage can induce carotenoid accumulation; therefore, nitrogen-deficient cultivation is suitable for the production of β-carotene and lutein together from the D. salina OH214 strain.
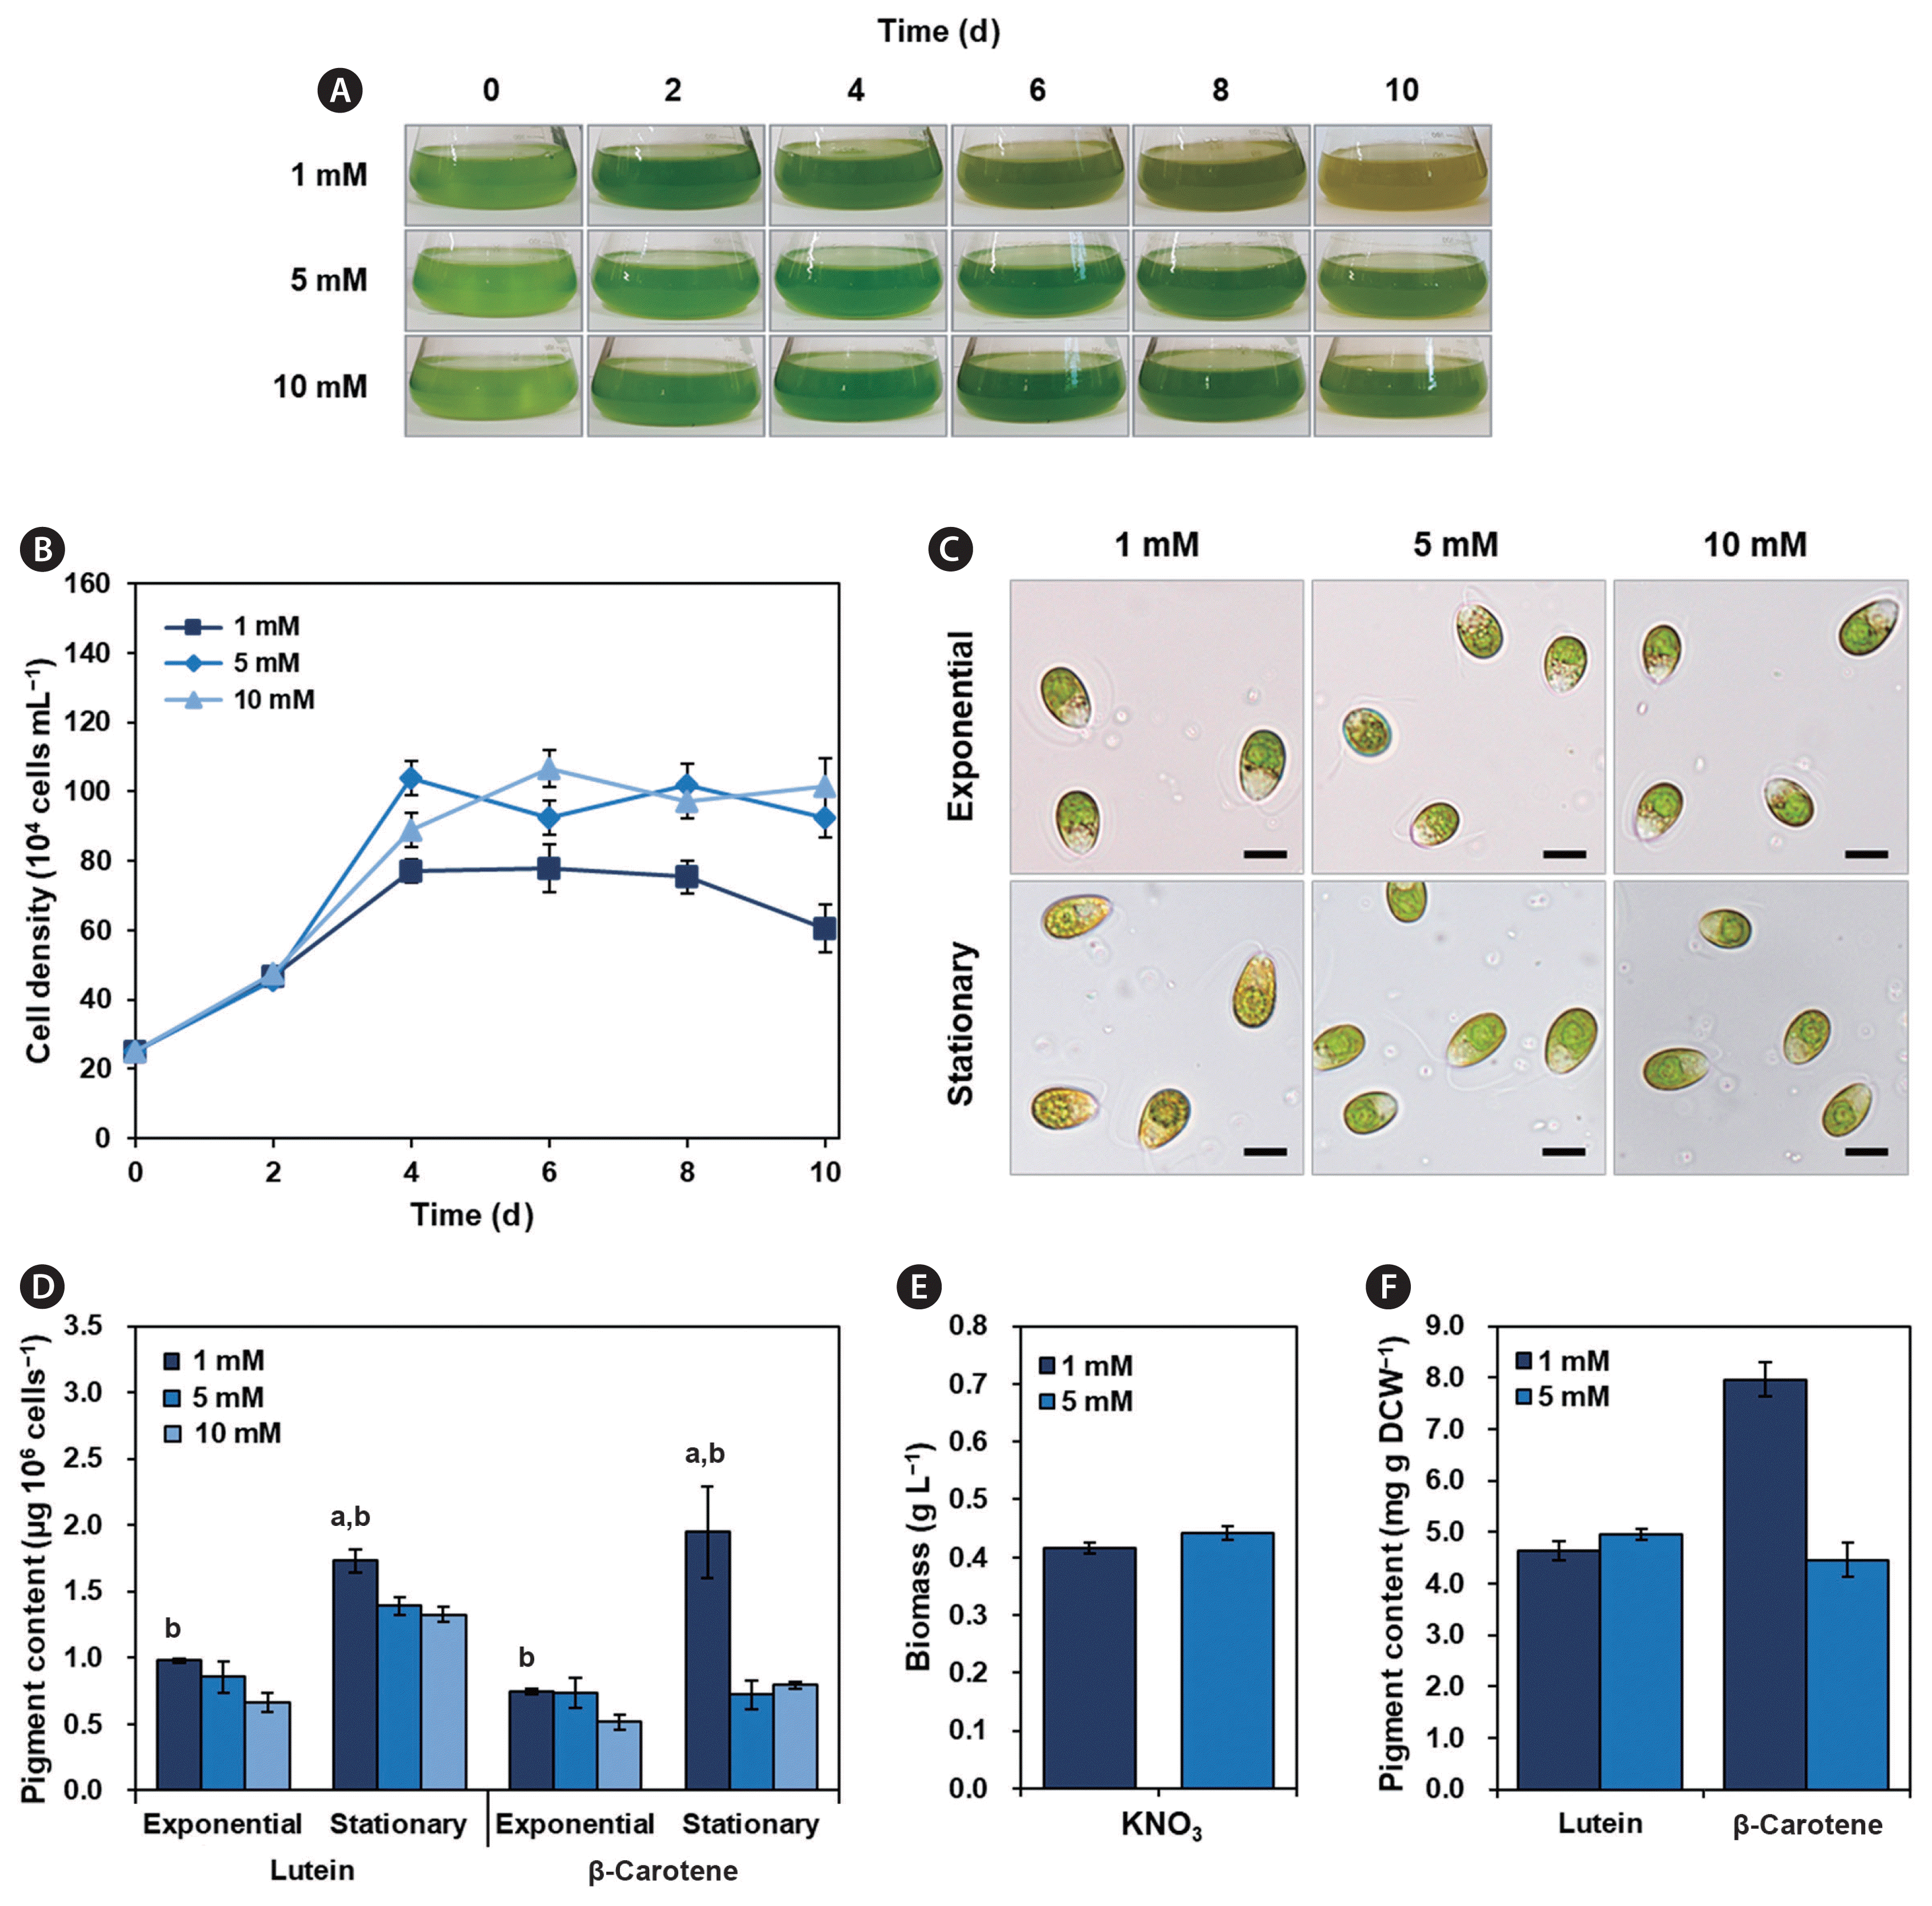
Physiological characteristics at various KNO3 concentrations. (A) Flask images. (B) Cell growth patterns. (C) Cell images on the exponential and stationary phase. (D) Lutein and β-carotene contents on the exponential and stationary phases (per cell number). (E) Biomass production of 1 and 5 mM KNO3 cultures on the stationary phase. (F) Lutein and β-carotene contents of 1 and 5 mM KNO3 cultures on the stationary phase (per biomass). Based on the growth patterns, the exponential and stationary phases were determined; exponential phase (day 2) and stationary phase (day 6). All experiments were conducted in triplicate. Statistical analysis was performed using Student’s t-test (a,bp < 0.05); avs. 5 mM; bvs. 10 mM. Scale bars represent: C, 10 μm.

Carotenoid contents at various nitrate concentrations
Potential of Dunaliella salina OH214 as a simultaneous producer of β-carotene and lutein
Under the selected culture conditions (0.6 M NaCl medium, low light, and nitrogen deficiency), it was confirmed that D. salina OH214 strain produced 7.97 ± 0.09 mg g DCW−1 of β-carotene and 4.65 ± 0.18 mg g DCW−1 of lutein, respectively (Fig. 5F). Although the β-carotene production capability of the D. salina OH214 strain does not exceed that of D. salina CCAP19/18 (Mil’ko 1963, Ben-Amotz et al. 1991, Ribeiro et al. 2011, Xu et al. 2018), D. salina OH214 has potential as a simultaneous producer of β-carotene and lutein.
The newly isolated D. salina OH214 showed relatively high β-carotene accumulation under the highest lutein production condition. Desmodesmus protuberanc (10.3 mg g−1), Desmodesmus denticulatus var. linearis (8.43 mg g−1), and Chlamydomonas planctogloea (7.4 mg g−1) are known lutein sources (Soares et al. 2019); however, these strains produce less than 1 mg g−1 of β-carotene, even after optimizing the culture condition for lutein production. The OH214 strain simultaneously produced 7.97 ± 0.09 mg g DCW−1 of β-carotene and 4.65 ± 0.18 mg g DCW−1 of lutein under optimized culture conditions. When the culture was irradiated with high light, the β-carotene content was increased by 2.5-fold higher than that under normal light conditions.
Although the lutein content of the D. salina OH214 strain was 46–62% of the lutein content of the above-mentioned strains, however, this strain showed more than 7-fold amount of β-carotene content compared to the freshwater strains. Moreover, the D. salina OH214 strain grows in seawater and saltpan water, unlike other freshwater species (Lin et al. 2015, Becerra et al. 2020). Its resistance to high salinity is beneficial for its cultivation on a large-scale using seawater. In the case of marine microalga, Muriellopsis species and Tetraselmis species have been reported to produce 6 and 3.17 mg g DCW−1 of lutein, respectively (Saha et al. 2018). However, the optimal salinity of Muriellopsis species ranges from 2 to 100 mM NaCl, which is a much lower salinity than natural seawater, and the maximal lutein content of other marine algae, Tetraselmis species is lower than that of the D. salina OH214 strain (4.95 ± 0.11 mg g DCW−1).
With the recent progress in strain improvement, along with the optimization of cultivation, carotenoid productivity has improved in several studies. Random mutagenesis using chemicals, a traditional and widely used method, can be used for strain improvement (Jin et al. 2003, Kim et al. 2017, Huang et al. 2018). In addition, fine optimization of culture conditions can increase carotenoid productivity. For example, the wild-type Chromochloris zofingiensis has only 3.08 mg g DCW−1 of lutein under normal autotrophic conditions. However, the C. zofingiensis mutant (CZ-bkt1), which has been isolated from the library of chemical mutagenesis, achieved 13.81 mg g DCW−1 of lutein production under stress conditions mixed with high-light irradiation and nitrogen starvation (Huang et al. 2018). Therefore, future studies should aim to understand the regulatory mechanisms involved in the carotenogenic response to nitrogen deficiency of D. salina OH214 strain and establish strategies for improving carotenoid productivity.
CONCLUSION
The green microalgae Dunaliella species can grow in a broad range of saline environments, and we consider it an ideal organism for carotenoid production using natural seawater. The strain newly reported in this study was classified as D. salina and named the OH214 strain. This strain grew well in 0.6 M NaCl salinity and turned orange / brown under high salinity (3 M NaCl), high-light conditions (500 ± 10 μmol photons m−2 s−1), and nitrogen-deficient conditions (1 mM KNO3). Interestingly, the D. salina OH214 strain has a strong light tolerance, showing enhanced growth upon high-light shift from low light. Under low-light conditions, the D. salina OH214 strain increased β-carotene by more than two-fold under nitrogen-deficient conditions, in which lutein content also increased moderately on a cellular basis. Therefore, the D. salina OH214 strain can be used as an effective producer of β-carotene and lutein under normal light with low concentration of nitrogen containing medium.
ACKNOWLEDGEMENTS
This research was supported by Basic Science Research Program (NRF2020R1A2C2011998) of the National Research Foundation (NRF) of Korea, funded by the Korean government. And this research was supported by Korea Environmental Industry & Technology Institute (KEITI) through “The project to develop eco-friendly new materials and processing technology derived from wildlife”, funded by Korea Ministry of Environment (MOE) (2021003270007).
Notes
The authors declare that they have no potential conflicts of interest.
SUPPLEMENTARY MATERIALS
18S rRNA sequence information for phylogenetic analysis (https://www.e-algae.org).
ITS sequence information for phylogenetic analysis (https://www.e-algae.org).
Partial internal transcribed spacer sequence of Dunaliella salina KCTC14434BP (https://www.e-algae.org).
Screening of orange colony (https://www.e-algae.org).
Alignment of internal transcribed spacer sequences between the newly isolated and the nearest strains (https://www.e-algae.org).