A guide to phylotranscriptomic analysis for phycologists
Article information
Abstract
Phylotranscriptomics is the study of phylogenetic relationships among taxa based on their DNA sequences derived from transcriptomes. Because of the relatively low cost of transcriptome sequencing compared with genome sequencing and the fact that phylotranscriptomics is almost as reliable as phylogenomics, the phylotranscriptomic analysis has recently emerged as the preferred method for studying evolutionary biology. However, it is challenging to perform transcriptomic and phylogenetic analyses together without programming expertise. This study presents a protocol for phylotranscriptomic analysis to aid marine biologists unfamiliar with UNIX command-line interface and bioinformatics tools. Here, we used transcriptomes to reconstruct a molecular phylogeny of dinoflagellate protists, a diverse and globally abundant group of marine plankton organisms whose large and complex genomic sequences have impeded conventional phylogenic analysis based on genomic data. We hope that our proposed protocol may serve as practical and helpful information for the training and education of novice phycologists.
INTRODUCTION
Understanding and refining phylogenetic relationships among species is a long-standing prerequisite for studying evolutionary biology. With access to many DNA sequences, researchers now routinely construct molecular phylogenetic trees using DNA or protein sequences. This approach is generally considered more reliable than morphological phylogenetic trees using morphological characters of species, given the low homoplasy, which confuses phylogenetic inference at the DNA or protein sequence level (Zou and Zhang 2016). The DNA sequences of a single or a few genes with considerable degrees of conservation across all species (e.g., small subunit ribosomal RNA) have been extensively used as molecular markers in phylogenetic studies. However, use of different genes often results in different trees (Rokas et al. 2003), partly due to sampling error or discordance between gene trees and species trees. Recent advances in genome sequencing technologies and substantial decreases in cost have made genomics readily available for phylogenetic studies. Phylogenomics, which involves reconstructing the phylogenetic and evolutionary history of a species by analyzing a large number of loci across the genome (Delsuc et al. 2005), can offer marked reductions in stochastic or sampling errors compared to those of the conventional approaches and has indeed led to several well-resolved phylogenies that likely represent the species trees. However, although DNA sequencing costs have decreased considerably in recent years, obtaining high-quality genome assemblies with annotation is still quite expensive and labor-intensive. Because of these challenges, there is still considerable difficulty in detecting orthologous genes, which is a crucial step in phylogenetic inference.
Transcriptome sequencing, also known as RNA sequencing (RNA-seq), was originally developed to measure the transcript abundance of all expressed genes in a sample using direct sequencing of transcripts by high-throughput sequencing technologies (Wang et al. 2009, Martin and Wang 2011). RNA-seq is one of the most cost-effective and versatile methods for efficiently obtaining the DNA sequences of orthologous genes; with increased taxon sampling, a phylogeny can be reliably inferred. Indeed, many authors in recent years have employed phylotranscriptomics to resolve the evolutionary relationships of diverse lineages of organisms (Hittinger et al. 2010, Kocot et al. 2011, Struck et al. 2011, von Reumont et al. 2012, Riesgo et al. 2014, Wickett et al. 2014, Zeng et al. 2014, Irisarri et al. 2017, Janouskovec et al. 2017, Murat et al. 2017, Price and Bhattacharya 2017). Phylotranscriptomics is especially useful where there is a lack of genomic data, as is the case with marine organisms in general. In our recent study (Cheon et al. 2020), we demonstrated that phylotranscriptomic trees are virtually identical to phylogenomic trees, regardless of the tissue of origin of the transcriptome data, and showed that the success of phylotranscriptomics relies on rigorous orthologous gene identification. Consequently, given the relatively low cost of transcriptome sequencing compared with genome sequencing, we foresee wider adoption of phylotranscriptomics in evolutionary studies.
In the present study, we developed a protocol, intended as a guide to aid phycologists with little or no background in bioinformatics programming, using an integrative analysis of high-throughput sequencing data. We hope that our proposed protocol may serve as practical and valuable information for the training and education of novice marine biologists.
Application in marine organisms
A greater understanding of marine organisms will provide essential insights into the evolutionary history and diversity of eukaryotes (Caron et al. 2017, Burki et al. 2020, Strassert et al. 2021). With the advancement of next-generation sequencing technologies, large-scale phylogenetics using genome or transcriptome sequences has become the standard tool for many previously unresolvable lineages (Delsuc et al. 2005, Meusemann et al. 2010, Kocot et al. 2011, Struck et al. 2011, Wickett et al. 2014, Zeng et al. 2014, Janouskovec et al. 2017, Cheon et al. 2020, Song et al. 2020). Because of the relatively small number of marine species for which complete genome sequences are available, transcriptome-based phylogenetic analysis is becoming increasingly popular in the phylogeny of marine organisms (Kocot et al. 2011, von Reumont et al. 2012, Irisarri et al. 2017). Here, we used transcriptomes to reconstruct a molecular phylogeny of dinoflagellate protists, a diverse and globally abundant group of marine plankton organisms whose large and complex genomic sequences have impeded conventional phylogenic analysis based on genomic data.
MATERIALS AND METHODS
Overview of the protocol
There are four steps to inferring a phylotranscriptomic tree from RNA-seq–based transcriptomes. First, we collect RNA-seq data from publicly available RNA-seq data (or one can use one’s own generated RNA-seq data). Second, we predict putative protein-coding sequences from de novo transcriptome assembly without a reference genome. Third, we identify orthologous genes that can be used for phylogenetic inference. Finally, a phylotranscriptomic tree is constructed based on a concatenated alignment of a set of inferred single copy (one-to-one) orthologs (Fig. 1). The details of our model protocol (using selected marine species) are given below.
Phylotranscriptomic analysis pipeline.
Data preparation
We selected 20 dinoflagellate and one alveolate species as an outgroup, with publicly available high-throughput RNA-seq data. The datasets used are summarized in Table 1.
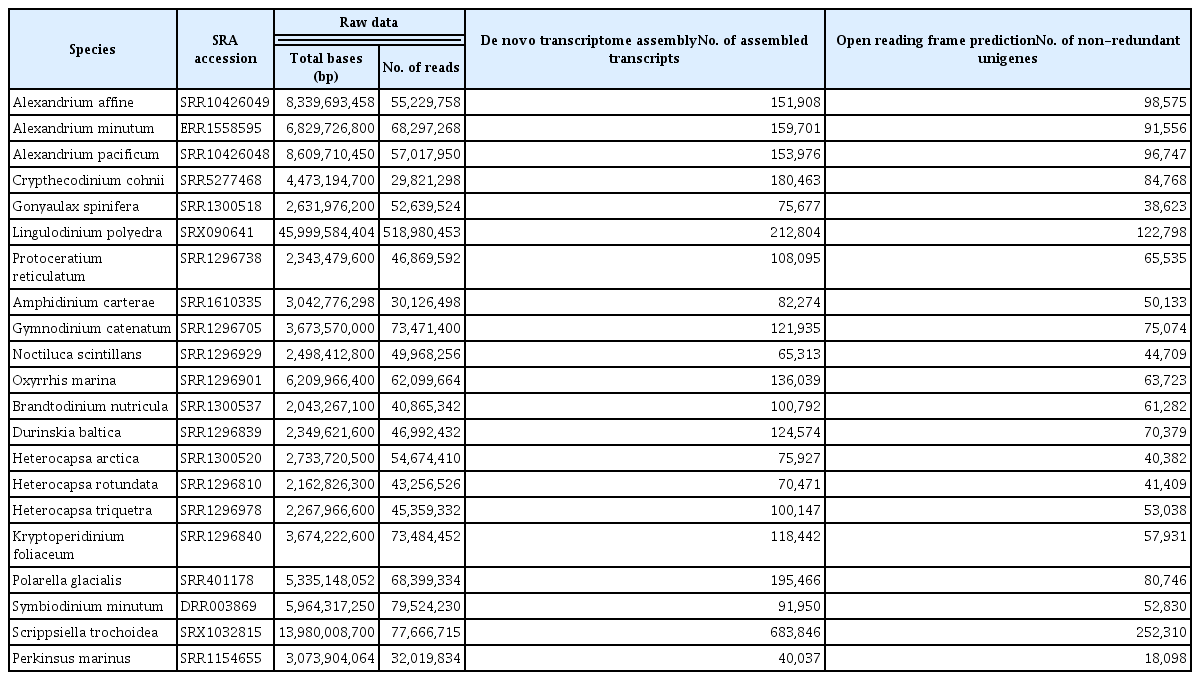
Summary statistics of dinoflagellate transcriptomes used in this study
Transcriptome data processing
All raw RNA-seq data sets were initially processed using Trimmomatic (v0.39) to obtain high-quality clean reads with no adapter sequences, poly-N sequences, or low-quality bases (Bolger et al. 2014). The remaining clean reads from each sample were then used for de novo transcriptome assembly using Trinity (version 2.2.0) (Haas et al. 2013) with default parameters. After transcriptome assembly, open reading frames (ORFs) were predicted using TransDecoder (version 3.0.0) (https://github.com/TransDecoder/TransDecoder/wiki) with BLASTP (Camacho et al. 2009) searches in the UniProtKB/Swiss-Prot database. ORFs of length less than 100 amino acids were discarded to avoid maintaining transcripts with insufficient evidence for protein-coding regions. To remove the redundant peptide sequences, protein sequences with >99% identity were clustered using the CD-HIT program (version 4.6.6) (Fu et al. 2012), and the longest sequence in each cluster was selected.
Inference of orthologous genes
From de novo assembled non-redundant protein-coding sequences in 21 transcriptomes (Table 1), putative orthologous genes were identified using the OrthoFinder tool (Emms and Kelly 2019). Pairwise sequence similarities between protein sequences were calculated using Diamond (Buchfink et al. 2015), and Markov clustering was applied with an inflation parameter of 1.5 for clustering orthogroups. To avoid complications introduced by paralogous genes in phylotranscriptomic inference, we excluded orthologous gene groups containing more than one gene from any given species and exclusively selected orthologous genes with genes present with one-to-one orthologs in at least 50% of the species in the group.
Construction of phylotranscriptomic tree
Amino acid sequences of one-to-one orthologous genes were aligned with Prank (http://wasabiapp.org/software/prank/) using default options. The aligned sequences with more than 70% of gaps were trimmed using Phyutility clean (option: -clean 0.3) (Smith and Dunn 2008). Any trimmed alignments <150 amino acids in length were discarded, and the remaining trimmed sequences were concatenated with Phyutility concat to construct the supermatrix. A maximum-likelihood tree was inferred using IQ-TREE (Minh et al. 2020) with the LG + C60 + R + F model and 1,000 ultrafast bootstrap replication.
Materials
We have provided all source codes and other technical details on our GitHub website: https://github.com/CSB-SeongminCheon/Phyco-phylo.
Equipment and setup
Critical
All commands in this protocol are run in a Bash shell on the GNU/Linux operating system. It is important to ensure that each software tool mentioned in this protocol is available within user’s your Bash PATH. The simplest way to do this is to run the following command:
$ echo ‘export PATH=“/home/user/local/tool_name: $PATH” ‘ >> ~/.bash_profile
‘/home/user/local/tool_name’ is the directory path of the application that is being installed.
Note
Consistent text formatting helps readers to interpret information. We use italic typeface for the Linux command line, and bold-italic typeface indicates the program name. The ‘$’ character at the beginning of a line of command indicates Linux shell.
Hardware
- 32-core processor (recommend: >8-core processor)
- 128 Gb (Gigabytes) of RAM (recommend: >32 Gb of RAM)
- At least 1 Tb (Terabyte) of memory space required for raw and processed sequence data (note: the amount of memory required depends on the number of tax and the size of the RNA-seq datasets)
Software
- Ubuntu 20.04 LTS (recommend LTS version)
- Python v.3.6 with Biopython package (https://biopython.org/)
- SRA Toolkit v.2.11.0 (https://www.ncbi.nlm.nih.gov/home/tools/)
- Trimmomatic v.0.39 (http://www.usadellab.org/cms/?page=trimmomatic)
- Samtools v.1.12 (http://www.htslib.org)
- Bowtie v.2.3 (http://bowtie-bio.sourceforge.net/bowtie2/index.shtml)
- Trinity v.2.2.0 (https://github.com/trinityrnaseq/trinityrnaseq)
- Transdecoder v.3.0.0 (https://github.com/TransDecoder/TransDecoder)
- BLAST+ v.2.9 (https://www.ncbi.nlm.nih.gov/home/download/)
- CD-hit v.4.6.6 (http://weizhongli-lab.org/cd-hit/)
- OrthoFinder v.2.5.2 (https://github.com/davidemms/OrthoFinder)
- DIAMOND v.0.9.24 (https://github.com/bbuchfink/diamond/releases)
- MCL v.14.137 (https://micans.org/mcl/)
- Prank v.17 (http://wasabiapp.org/software/prank/)
- Phyutility v.2.7.1 (https://github.com/blackrim/phyutility)
- IQ-Tree v.2.1.2 (http://www.iqtree.org/)
Executable files of all the above programs should be created and saved in your working directory, such as ‘/home/user/bin’. Please see the following GitHub website for details of the installation or compile process on Linux/UbuntuOS operation system: https://github.com/CSB-SeongminCheon/Phyco-phylo.
Procedure
Data preparation
1. Download 21 RNA-seq data (Table 1) from the NCBI SRA database (https://www.ncbi.nlm.nih.gov/sra) and convert the SRA files into FASTQ files using the fastq-dump program of the SRA Toolkit. The collected dataset and command lines can be found at the GitHub site: https://github.com/CSB-SeongminCheon/Phyco-phylo.
$ fastq-dump --defline-seq ‘@$sn[_$rn]/$ri’ --split-files SRA_AccessionID
Preprocessing of RNA-seq data and de novo transcriptome assembly
2. Obtain high-quality clean reads and assemble them using Trinity software. This tool must work separately on each RNA-seq sample. Please note that the output directory name must include ‘trinity.’
$ Trinity --seqType fq --trimmomatic --quality_trimming_params “ILLUMINACLIP:/home/your/path/trinity-plugins/Trimmomatic-0.36/adapters/TruSeq3-PE.fa:2:30:10 LEADING:3 TRAILING:3 SLIDINGWINDOW:4:15 MINLEN:36” --max_memory 200G --CPU 32 --full_cleanup --left forward_reads_1.fastq --right reverse_reads_2.fastq --output trinity_output_Name
Prediction of non-redundant protein-coding sequences
3. Predict ORFs from each de novo assembled transcript using TransDecoder.
$ TransDecoder.LongOrfs -t trinity_output_Name/Trinity.fasta -S
4. Download UniProt/Swiss-Prot protein databases, which are manually reviewed and more reliable.
$ gzip -d uniport_sprot.fata.gz
5. Make a BLAST database with the UniProt/Swiss-Prot protein databases using makeblastdb program from BLAST+.
$ makeblastdb -i uniport_sprot.fasta -dbtype prot
6. Execute BLASTP to compare the output of TransDecoder.LongOrfs with the UniProt/Swiss-Prot protein databases.
$ blastp -query Trinity.fasta.transdecoder_dir/longest_orfs.pep -db uniprot_sprot.fasta -max_target_seqs 1 -outfmt 6 -evalue 10 -num_threads 32 -out Genus_Species.outfmt6
7. Identify ORFs using the TransDecoder tool.
$ TransDecoder.Predict -t Trinity.fasta –retain_blastp_hits Genus_Species.outfmt6
8. Cluster sequences with 99% similarity, and select the longest sequence in each cluster as a representative sequence of that cluster by using CD-HIT:
$ cd-hit -I Trinity.fasta.transdecoder.pep -o Genus_Species.fa.cdhit -c 0.99 -n 5
9. Modify a description line of the FASTA formatted CD-HIT outputs to prevent special characters (e.g., “-”, and “*”) from hindering downstream analyses. The corresponding Python code can be found at the GitHub site: https://github.com/CSB-SeongminCheon/Phyco-phylo/blob/main/fix_names_from_CDhit.py.
$ Python fix_names_from_CDhit.py Genus_Species.fa.cdhit GenusName SpeciesName
Inference of orthologous genes.
10. Run OrthoFinder to infer the orthogroups.
$ orthofinder -f WorkingDirectory/
11. Select orthologous genes with genes present with one-to-one orthologs in at least 50% of the species in the group. The corresponding Python code can be found at the GitHub site: https://github.com/CSB-SeongminCheon/Phyco-phylo/blob/main/singlecopy_from_OrthoFinder.py.
$ python singlecopy_from_OrthoFinder.py WorkingDirectory SingleCopyResults
Generation of phylotranscriptomic tree.
12. Perform multiple sequence alignment for each one-to-one orthogroup with prank_wrapper Python script implementing Prank alignment software. The corresponding Python code can be found at the GitHub site: https://github.com/CSB-SeongminCheon/Phyco-phylo/blob/main/prank_Wrapper.py.
$ python prank_Wrapper.py SingleCopyResults
13. Identify and remove poorly aligned sequences with >70% of gaps using Phyutility. The corresponding Python code can be found at the GitHub site: https://github.com/CSB-SeongminCheon/Phyco-phylo/blob/main/phyutility_Wrapper.py.
$ python phyutility_Wrapper.py SingleCopyResults 0.3
14. Concatenate multiple alignments of the one-to-one orthogroup, and only select concatenated alignments with >150 amino acids for the downstream analysis of phylotranscriptomic tree. The corresponding Python code can be found at the GitHub site: https://github.com/CSB-SeongminCheon/Phyco-phylo/blob/main/supermatrix_concatenate.py.
$ python supermatrix_concatenate.py SingleCopyResults 150 11 Dinoflagellate_Supermatrix
15. Run IQ-Tree tool with the LG+C60+R+F model and 1,000 ultrafast bootstrap replication.
$ iqtree -s Dinoflagellate_Supermatrix.phy -spp Dinoflagellate_Supermatrix.model -m LG+C60+R+F -bb 1000 -nt 80
RESULTS AND DISCUSSION
Anticipated results
Our protocol was adopted for reconstructing a dinoflagellate phylotranscriptomic tree. After preprocessing and assembling procedures of 21 transcriptome data sets, the average number of non-redundant putative protein-coding sequences predicted per sample was 74,316 (Table 1). When gene orthology inference was performed with OrthoFinder, 351,269 orthogroups present in more than one unigene within or between species were identified. This study restricted our investigation to only 306 orthogroups containing exactly one gene in at least 11 species (out of 21; greater than 50%). After excluding multiple sequence alignments of less than 150 amino acid residues, the final alignment of 64,147 aligned positions from 250 orthogroups was used for maximum-likelihood analysis using IQ-Tree under the LG + C60 + R + F model with 1,000 replications. The reconstructed dinoflagellate phylotranscriptomic tree is resolved with each interior branch, with >98% bootstrap support (Fig. 2), and its tree topology is mainly congruent with previously published molecular phylogenetic trees (Janouskovec et al. 2017, Price and Bhattacharya 2017, Stephens et al. 2018), with some exceptions. For example, in our tree, the dinoflagellates Noctiluca scintillans and Amphidinium carterae are sister taxa, although they are not part of the same clade in the tree constructed by Stephens et al. (2018), and the position of Suessiales clade is incongruent between our tree and the one proposed by JanouŠkovec et al. (2017). Such slight discrepancies in phylogenetic topologies may be due to the number of taxa studied and the different ortholog identification algorithms.

Dinoflagellate phylotranscriptomic tree.
CONCLUSION
Orthology inference is the most crucial step in transcriptome-based phylogenetics, but can be challenging due to the incomplete genomic data and the complexity of transcriptome data. Therefore, in this study, we present a user-friendly protocol for phylotranscriptomic analysis to assist field and experimental biologists unfamiliar with UNIX command-line interface and bioinformatics tools. With a practical case study of reconstructing the dinoflagellate phylotranscriptomic tree, it is suggested that transcriptome sequence data may become the standard for generating large and phylogenetically informative data sets and will offer fascinating insights into the understanding of evolutionary history of organisms and their genomes. Finally, we hope that our proposed protocol may serve as practical and valuable information for the training and education of novice marine biologists.
ACKNOWLEDGEMENTS
We thank the CSB lab members. This research was supported by the Basic Science Research Program of the National Research Foundation of Korea (NRF), funded by the Ministry of Education (NRF-2019R1F1A1062411 to CP, NRF-2016R1A6A1A03012647 to H-G Lee, NRF-2020R1A2C3005053 to KYK) and by the “Research center for fishery resource management based on the information and communication technology,” funded by the Ministry of Oceans and Fisheries, Korea (2021, grant number 20180384 to CP).
Notes
CONFLICTS OF INTEREST
Kwang Young Kim serves as editor for the Algae, but has no role in the decision to publish this article. All remaining authors have declared no conflicts of interest.