Lee, Jeong, Kang, Ok, You, Park, and Eom: Comparison of the spatial-temporal distributions of the heterotrophic dinoflagellates Gyrodinium dominans, G. jinhaense, and G. moestrupii in Korean coastal waters
ABSTRACT
Heterotrophic dinoflagellates Gyrodinium spp. are one of the major grazers of phytoplankton in many coastal waters. Gyrodinium dominans, G. jinhaense, and G. moestrupii have similar morphologies but different edible prey species. To explore the variations in the ecological niches of these three species, we investigated their spatial-temporal distributions in Korean waters. Because of the high similarity in morphology among these three Gyrodinium species, we used real-time polymerase chain reactions to quantify their abundance in water samples that were seasonally collected from 28 stations along the Korean Peninsula from April 2015 to October 2018. Cells of G. dominans were found at all sampling stations, G. jinhaense at 26 stations, and G. moestrupii at 22 stations, indicating that all three species were widely distributed in Korea. Furthermore, all three species displayed strong seasonal distributions. The largest numbers of the stations where G. dominans and G. jinhaense cells were present were found during the summer (26 and 23 stations, respectively), but that for G. moestrupii was found in the autumn (15 stations). The abundance of G. dominans was positively correlated with that of G. jinhaense, but not with that of G. moestrupii. The highest abundances of G. dominans (202.5 cells mL−1) and G. jinhaense (20.2 cells mL−1) were much greater than that of G. moestrupii (1.2 cells mL−1). The highest abundances of G. dominans and G. jinhaense were found in July, whereas that of G. moestrupii was found in March. The abundances of G. dominans and G. jinhaense, but not G. moestrupii, were positively correlated with water temperature. Therefore, the spatial-temporal distributions of G. dominans and G. jinhaense were closer than those of G. moestrupii and G. dominans or G. jinhaense. This differs from results based on the relative differences in ribosomal DNA sequences and the types of edible prey reported in the literature. Thus, the variations in spatial-temporal distributions and prey species of these three Gyrodinium species suggest that they may have different ecological niches in Korean coastal waters.
Key words: Chl-a; harmful algal bloom; protist; qPCR; red tide; specific primer
INTRODUCTION
Dinoflagellates are ubiquitous and major components of marine ecosystems ( Smayda 1997, Jeong 1999, Baker 2003, Sherr and Sherr 2007, Taylor et al. 2008, Stern et al. 2010, Lee et al. 2020). They possess all three trophic modes: autotrophy, heterotrophy, and mixotrophy ( Menden-Deuer et al. 2005, Burkholder et al. 2008, Jeong et al. 2010, 2021, Hansen 2011, Stoecker et al. 2017). In marine planktonic food webs, heterotrophic dinoflagellates are predators of heterotrophic bacteria, cyanobacteria, microalgae, and eggs and early naupliar stages of metazoans ( Hansen 1991, Strom and Buskey 1993, Buskey et al. 1994, Jeong 1994, Jeong and Latz 1994, Kiφrboe and Titelman 1998, Jeong et al. 2008, 2010, Kang et al. 2020), and also prey for diverse metazoans ( Gifford and Dagg 1991, Xu et al. 2017, Traboni et al. 2020). Furthermore, heterotrophic dinoflagellates impose a considerable grazing impact on populations of microalgae, causing red tides or harmful algal blooms ( Johnson et al. 2003, Menden-Deuer et al. 2005, Jeong et al. 2015, Lim et al. 2017). Therefore, understanding their spatial-temporal distributions is a critical concern for scientists and aquaculture farmers. The genus Gyrodinium is one of the major dinoflagellate groups and is widespread in the world’s oceans ( Larsen 1996, Daugbjerg et al. 2000, Takano and Horiguchi 2004, Sherr and Sherr 2007, Kilias et al. 2013). Among the species in this genus, heterotrophic species such as Gyrodinium dominans and Gyrodinium moestrupii are known to feed on diverse algal species and sometimes control prey populations ( Nakamura et al. 1995a, 1995b, Kim and Jeong 2004, Potvin et al. 2013, Yoo et al. 2013a, 2013b, Lee et al. 2014, Kang et al. 2018, 2020, Jang et al. 2019). Recently, Gyrodinium jinhaense, isolated from Korean waters, was newly described by Jang et al. (2019). The size of G. jinhaense (equivalent spherical diameter = 10.2 μm) is smaller than that of G. dominans (11.6 μm) or G. moestrupii (16.0 μm) ( Jang et al. 2019, Kang et al. 2020). Furthermore, among the 20 prey species tested, G. jinhaense was able to feed on 15 prey species, fewer than that of G. dominans (19 species) and G. moestrupii (18 species) ( Kang et al. 2020). Moreover, these three Gyrodinium species respond differently to the chlorophyte Dunaliella salina and the phototrophic dinoflagellates Prorocentrum cordatum and Scrippsiella acuminata ( Kang et al. 2020). Thus, these Gyrodinium species may have different spatial and temporal distributions and ecological niches. However, there have been no study on distributions of these three Gyrodinium species yet. Although the equivalent spherical diameters of G. dominans, G. jinhaense, and G. moestrupii differ from one another, the ranges of their cell length and width overlap ( Jang et al. 2019). Furthermore, the overall morphologies of these three Gyrodinium species in fixed samples are similar ( Hansen and Daugbjerg 2004, Yoon et al. 2012, Jang et al. 2019). Therefore, to distinguish one from the others, molecular techniques are needed, as in other studies which investigate dinoflagellate species which are morphologically similar ( Smith et al. 2016, Lee et al. 2017, 2019, 2020, Kang et al. 2019, Jang and Jeong 2020). To investigate the spatial and temporal distributions of G. dominans, G. jinhaense, and G. moestrupii, we quantified their abundances in the waters of 28 stations along the Korean Peninsula from 2015 to 2018, after developing species-specific primer and probe sets. Furthermore, to explore the effects of major environmental factors on species distributions, we measured water temperature, salinity, and chlorophyll- a in the water samples. The results of the present study provide a basis for better understanding the ecophysiology of G. dominans, G. jinhaense, and G. moestrupii, as well as the evolution of the genus.
MATERIALS AND METHODS
Cultures of three Gyrodinium species
To explore the distributions of G. dominans, G. jinhaense, and G. moestrupii, quantitative real-time polymerase chain reaction (qPCR) analysis was performed using clonal cultures of the three Gyrodinium species ( Table 1): G. dominans (GDJK1907), originally isolated from Jeongok Harbor, Korea in July 2019; G. jinhaense (GSJH1710), originally isolated from Jinhae Bay, Korea, in October 2017; and G. moestrupii (GMSMK0910), originally isolated from Saemangeum, Korea, in October 2009 ( Yoon et al. 2012, Jang et al. 2019, Kang et al. 2020). To maintain G. dominans, a clonal culture was provided with cells of the phototrophic dinoflagellate Amphidinium carterae (SIO PY-1) as prey. A 250-mL polycarbonate (PC) bottle containing the culture was placed on a plankton wheel rotating at 0.9 rpm (0.00017 g). The bottle was incubated at 20°C and 20 μE m−2 s−1 illumination on a 14-h light : 10-h dark cycle. To maintain G. jinhaense, a clonal culture was provided with heat-killed cells of the chlorophyte D. salina (DSJH1710) as prey and a 250-mL tissue culture flask (Falcon, Heidelberg, Germany) containing the culture was placed on a shelf and incubated at 20°C under the same light conditions as described above. To maintain G. moestrupii, a clonal culture was provided with cells of the phototrophic dinoflagellate Alexandrium minutum (CCMP113) as prey and a 250-mL PC bottle containing the culture was placed on a plankton wheel rotating at 0.9 rpm (0.00017 g) and incubated at 20°C under the light conditions as described above.
Species-specific primer and probe design, and specificity analysis
To develop the species-specific primer and probe set of G. dominans, the internal transcribed spacer ribosomal DNA sequence was obtained ( Table 2). Then, sequences of G. dominans were aligned with sequences of other Gyrodinium species and related dinoflagellates, which were available from GenBank, using the program MEGA ver. 4 ( Tamura et al. 2007). Manual searches of the alignments were conducted to identify unique sequences for developing the G. dominans–specific qPCR assay. The sequences for the primer-probe set were selected from the regions that were conserved in G. dominans but allowed for discrimination with other dinoflagellates. Primers and probe sequences of each species were analyzed using Primer 3 (Whitehead Institute and Howard Hughes Medical Institute, MD) and Oligo Calc: Oligonucleotide Properties Calculator ( Kibbe 2007) software to determine the optimal melting temperature and secondary structure. Subsequently, primers and probes were synthesized by Bioneer (Daejeon, Korea). Each probe was dual labeled with the fluorescent dyes FAM and BHQ1 (Bioneer) at the 5′ and 3′ ends, respectively ( Table 2). The development of the species-specific primer and probe sets of G. jinhaense or G. moestrupii were also conducted using the methods described above. To validate the specificity of the specific primer and probe set for each of these three Gyrodinium species, a specificity analysis was conducted using DNA extracts of other Gyrodinium species, related species, and their prey species. Then, the following steps, modified from Lee et al. (2018), were conducted using the primers and probe for each target species: 1 μL of the DNA template, 0.2 μM of the specific primers (forward and reverse), 0.15 μM of the specific probe (final concentration), and 5 μL of the qPCRBIO Probe Separate-ROX (Genepole, Gwangmyeong, Korea) were combined, and deionized sterilized water (DDW) was added to each sample, resulting in a total final volume of 10 μL. The qPCR assay was performed using Rotor-Gene Q (Qiagen, Hilden, Germany) under the following thermal cycling conditions: 3 min at 95°C, followed by 45 cycles of 10 s at 95°C, and 40 s at 58°C.
Generation of the standard curve
Standard curves for determining the abundance of each of the three Gyrodinium species were obtained using DNA extracted from the exponential growth phase culture of each species. DNA was extracted from 10,000 cells each of G. dominans, G. jinhaense, and G. moestrupii, and the final elution volume of 100 μL was extracted using an AccuPrep Genomic DNA extraction kit (Bioneer) according to the manufacturer’s instructions. The extracted DNA of G. dominans, G. jinhaense, and G. moestrupii was then serially diluted by adding predetermined volumes of DDW to 1.5-mL tubes to prepare five different DNA concentrations, targeting 100, 10, 1, 0.1, and 0.01% DNA concentrations of the originally extracted DNA. The extracted and diluted DNA samples were then stored at −20°C in a freezer and qPCR amplification was conducted within a day. qPCR amplification was used to construct a standard curve using the aforementioned methods and conditions detailed in the specificity analysis section.
Collection of field samples
The field samples for this study were obtained from our previous studies ( Lee et al. 2018, 2019, Jang and Jeong 2020). These samples were collected from April 2015 to October 2018 from the surface waters located in the 28 stations of the East, West, and South Seas, as well as on Jeju Island, Korea ( Fig. 1). Surface water samples from each station were collected using a clean bucket, and the physical and chemical properties were obtained using these samples.
Quantification of the abundance of three Gyrodinium species
qPCR analysis was performed to determine the distribution of the three Gyrodinium species in Korean waters. First, cells in 50–300 mL of each water sample collected from each station at each time interval were collected by filtering through a 25-mm GF/C filter (Whatman Inc., Clifton, NJ, USA). The filter was loosely rolled, placed into a 1.5-mL tube, and frozen at −20°C until it was transported to the laboratory. Subsequently, DNA was extracted from the collected cells that were captured on the filters using an AccuPrep Genomic DNA extraction kit (Bioneer) according to the manufacturer’s instructions. Extracted DNA was stored at −20°C until qPCR was performed. In addition, to ensure accuracy of the results, DNA from each sample was amplified four times. Samples using DDW as the template were used as non-template controls, samples using only DDW as the template and reaction mix were used as negative controls, and DNA used to construct the standard curve was used as a positive and standard control. The conditions used for qPCR and quantification of the abundances of the three Gyrodinium species in the field samples were similar to those listed in the specificity analysis section.
Data analysis
Statistical analyses were performed using the statistical software package SPSS ver. 25.0 (IBM Corp., Armonk, NY, USA). Pearson’s correlation analysis was used to determine any one-to-one relationships between the cell abundances of the three Gyrodinium species and environmental factors.
RESULTS
Spatial and temporal distributions of three Gyrodinium species in Korean waters
We successfully developed specific primer and probe sets for G. dominans, G. jinhaense, and G. moestrupii ( Table 2). Using these sets, we quantified the abundance of each species in the water samples collected from the 28 stations from April 2015 to October 2018 and investigated the specific spatial and temporal distribution of each Gyrodinium species. In general, all three species had nationwide distributions in Korean coastal waters ( Fig. 2). During the study period, G. dominans was found at all 28 sampling stations, G. jinhaense was found at 26 stations, and G. moestrupii was found at 22 stations ( Fig. 2). All three Gyrodinium species were found at 21 stations, G. dominans and G. jinhaense without G. moestrupii were found together at five stations, and G. dominans and G. moestrupii without G. jinhaense were found together at one station. G. dominans was found alone at one station. Among the 399 samples collected during the study period, all three Gyrodinium species were found in seven samples, G. dominans and G. jinhaense without G. moestrupii were found together in 51 samples, G. dominans and G. moestrupii without G. jinhaense were found together in seven samples, and G. jinhaense and G. moestrupii without G. dominans were found together in two samples ( Fig. 3). However, G. dominans alone was found in 89 samples, G. jinhaense alone in 25 samples, and G. moestrupii alone in 16 samples. Cells of G. dominans were detected at 26 stations in summer, 20 stations in spring, 22 stations in autumn, and 12 stations in winter ( Fig. 4, Supplementary Table S1, Fig. S1). The highest abundance of G. dominans (202.5 cells mL −1) was found in Jinhae Bay (South Sea) in July 2017, where the water temperature and water salinity were 23.8°C and 28.3, respectively. Cells of G. jinhaense were detected at 23 stations in the summer, four stations in the spring, 17 stations in the autumn, and eight stations in the winter ( Fig. 5, Supplementary Table S2, Fig. S1). Cells of G. jinhaense were not detected in the waters of Buan (West Sea) and Gosan (Jeju Island) ( Fig. 2). The highest abundance of G. jinhaense (20.2 cells mL −1) was found in the waters off Masan (South Sea) in July 2016, where the water temperature and water salinity were 24.0°C and 9.9, respectively. Cells of G. moestrupii were detected at 15 stations in autumn, four stations in the spring, five stations in the summer, and four stations in the winter ( Fig. 6, Supplementary Table S3, Fig. S1). Cells of G. moestrupii were not detected in the waters of Sokcho, Jumunjin (East Sea), Mokpo (West Sea), Gosan, Seogwipo, and Seongsan (Jeju Island) ( Fig. 2). The highest abundance of G. moestrupii (1.2 cells mL −1) was found in the waters off Tongyeong (South Sea) in March 2016, where the water temperature and water salinity were 13.4°C and 33.4, respectively.
Hydrographic properties during the study period
The range of water temperature in which each Gyrodinium species was found in the Korean coastal waters during the study period was 3.8–26.4°C for G. dominans, 1.7–25.8°C for G. jinhaense, and 7.4–27.1°C for G. moestrupii ( Table 3, Fig. 7). Furthermore, the range of salinity in which each Gyrodinium species was found was 9.6–35.6 for G. dominans, 9.9–34.4 for G. jinhaense, and 0.1–35.6 for G. moestrupii ( Table 3, Fig. 7).
Relationships between Gyrodinium species abundance and environmental factors
The abundance of G. dominans was positively correlated with that of G. jinhaense (p < 0.001, r = 0.195), but not with that of G. moestrupii ( Table 4). The abundance of G. dominans was significantly and positively correlated with Chl- a concentration (p < 0.001, r = 0.548) and water temperature (p = 0.001, r = 0.167), but negatively correlated with water salinity (p = 0.011, r = −0.128) ( Table 4). The abundance of G. jinhaense was significantly and positively correlated with water temperature (p = 0.001, r = 0.161) and negatively correlated with water salinity (p < 0.001, r = −0.244) ( Table 4). However, there were no significant correlations between the abundance of G. jinhaense and Chl- a concentration ( Table 4). The abundance of G. moestrupii was significantly and negatively correlated with water salinity (p = 0.042, r = −0.102). However, there were no significant correlations between the abundance of G. moestrupii and water temperature or Chl- a concentration ( Table 4).
DISCUSSION
Heterotrophic dinoflagellates Gyrodinium spp. are one of the major grazers on phytoplankton in many coastal waters ( Kim and Jeong 2004, Jeong et al. 2011, 2014, Yoo et al. 2013b, Anderson and Menden-Deuer 2017, Kang et al. 2020). For many years, G. dominans was representative of small heterotrophic Gyrodinium species before the small heterotrophic G. moestrupii and G. jinhaense were described in 2012 and 2019, respectively ( Yoon et al. 2012, Jang et al. 2019); thus, some small heterotrophic Gyrodinium species in the water samples may be G. jinhaense or G. moestrupii. The prey of one of G. dominans, G. jinhaense, and G. moestrupii differs from that of the other species ( Yoo et al. 2013b, Kang et al. 2020). Furthermore, the growth and ingestion rates of one of these three Gyrodinium species on target prey species also differ from those of the other Gyrodinium species ( Kim and Jeong 2004, Yoo et al. 2013b, Kang et al. 2020). To assess the ecological roles of each of these Gyrodinium species in marine planktonic food webs, the abundance of each species should be quantified. The three heterotrophic dinoflagellates studied here have similar morphology, and, thus, it is difficult to distinguish them from each other in live and fixed samples under light microscopy ( Fig. 8); thus, molecular methods are needed. In the present study, we successfully developed a species-specific primer and probe set for each species and quantified their abundance using qPCR. These primer and probe sets can be used to quantify the abundance of each species in other regions to better understand the wider ecological roles of G. dominans, G. jinhaense, and G. moestrupii. During the study period, all three Gyrodinium species were found at 21 stations and in seven samples, G. dominans and G. jinhaense were found together at five stations and in 51 samples, and G. dominans and G. moestrupii were found together at one station and in seven samples. Cells of G. dominans were found at all 28 sampling stations and in 154 samples (39% of 399 samples), G. jinhaense cells were found at 26 stations and in 85 samples (21%), and G. moestrupii cells were found at 22 stations and in 32 samples (8%). These results support our contention that the abundance of each small heterotrophic Gyrodinium species should be quantified by establishing primer and probe sets and using the qPCR method. If all small heterotrophic Gyrodinium species are assumed to be G. dominans, the abundance of G. dominans and its grazing impact on prey populations may be overestimated. However, because G. dominans did predominate over G. jinhaense or G. moestrupii in the number of stations where each species was found in Korean waters, assuming that all small heterotrophic Gyrodinium species are G. dominans may produce smaller errors than assuming that all small heterotrophic Gyrodinium species are G. jinhaense or G. moestrupii in situations where only light microscopy without qPCR, or only old data, is available for quantification. In particular, in the spring, G. dominans was found at 20 stations, but G. jinhaense and G. moestrupii were only found at four stations. This indicates that the scope for error that all small heterotrophic Gyrodinium species are not G. dominans is small in the spring samples.
The highest abundances of G. dominans and G. jinhaense were found in Jinhae Bay and Masan Bay in July, respectively, whereas that of G. moestrupii was found in its highest abundances in the waters off Tongyeong in March. Jinhae Bay, Masan Bay, and Tongyeong are located in the South Sea of Korea. The water temperatures when G. dominans and G. jinhaense exhibited their highest abundances were very similar (23.8 and 24.0°C, respectively); however, these water temperature were much greater than those where G. moestrupii displayed its highest abundance (13.4°C). Furthermore, the range of water temperature in which G. dominans was found (3.8–26.4°C) was similar to that of G. jinhaense (1.7–25.8°C), but somewhat differed from that of G. moestrupii (7.4–27.1°C). Thus, G. dominans and G. jinhaense may have similar responses to water temperature, which differ from the response of G. moestrupii. The salinities where G. dominans (28.3), G. jinhaense (9.9), and G. moestrupii (33.4) had the highest abundances were very different from one another. Therefore, G. dominans, G. jinhaense, and G. moestrupii may have unique salinity preferences that differ from that of the other species.
The highest abundance of G. dominans (202.5 cells mL −1) was much greater than that of G. jinhaense (20.2 cells mL −1) or G. moestrupii (1.2 cells mL −1). The maximum growth rate of G. dominans on its optimal prey, Prorocentrum donghaiense (1.62 d −1), was comparable to that of G. moestrupii on its optimal prey, A. minutum (1.60 d −1), but much higher than that of G. jinhaense on its optimal prey, D. salina (0.655 d −1) ( Yoo et al. 2013b, Kang et al. 2020, You et al. 2020). The abundance of G. dominans was significantly correlated with Chl- a concentration, whereas that of G. jinhaense or G. moestrupii was not correlated with Chl- a concentration. The Chl- a concentration when the highest abundance of each species was found during the study period was 127.0, 6.8, and 0.9 ng Chl- a mL −1 for G. dominans, G. jinhaense, and G. moestrupii, respectively. Assuming that the ratio of carbon to Chl- a was 40 ( Peterson and Festa 1984) and all Chl- a were attributed to P. donghaiense, using the equation of You et al. (2020), the calculated growth rate of G. dominans on P. donghaiense at 127 ng Chl- a mL −1 (5,080 ng C mL −1) would be 1.09 d −1. Similarly, if all Chl- a belonged to D. salina, using the equation of Kang et al. (2020), the calculated growth rate of G. jinhaense on D. salina at 6.8 ng Chl- a mL −1 (270 ng C mL −1) would be 0.20 d −1. In the same manner, if all Chl- a belonged to A. minutum, using the equation of Yoo et al. (2013b), the calculated growth rate of G. moestrupii on A. minutum at 0.9 ng Chl- a mL −1 (36 ng C mL −1) would be 1.30 d −1. The results of these calculations suggest that when each of these two Gyrodinium species were in their highest abundances, G. dominans may have had enough preferred prey to support its growth, whereas G. moestrupii may not have had sufficient amounts of prey. There were smaller differences in the ribosomal DNA sequences and prey species preferences between G. dominans and G. moestrupii than those between G. dominans and G. jinhaense ( Kang et al. 2020). However, the spatial-temporal distributions of G. dominans and G. jinhaense in Korean waters identified during the present study were closer than those of G. dominans and G. moestrupii. Therefore, differences in ribosomal DNA sequences and also the kind of the edible prey species among these Gyrodinium species may not affect spatial-temporal distributions. Physical-chemical properties such as water temperature and salinity and biological properties such as competition and predation may more strongly influence the differences in the distributions of these Gyrodinium species.
ACKNOWLEDGEMENTS
We thank Eun Chong Park, Ji Eun Kwon, and So Jin Kim for technical support. This work was supported by the useful dinoflagellate program of Korea Institute of Marine Science and Technology Promotion (KIMST) funded by the Ministry of Oceans and Fisheries (MOF) and the National Research Foundation (NRF) funded by the Ministry of Science and ICT (NRF-2017R1E1A1A01074419; NRF-2020M3F6A1110582) award to HJJ.
SUPPLEMENTARY MATERIALS
Supplementary Table S1. The abundance (cells mL −1) of Gyrodinium dominans at each station from April 2015 to October 2018, quantified using qPCR ( https://e-algae.org).
Supplementary Table S2. The abundance (cells mL −1) of Gyrodinium jinhaense at each station from April 2015 to October 2018, quantified using qPCR ( https://e-algae.org).
Supplementary Table S3. The abundance (cells mL −1) of Gyrodinium moestrupii at each station from April 2015 to October 2018, quantified using qPCR ( https://e-algae.org).
Supplementary Fig. S1. Map of the sampling stations, indicating the abundances of Gyrodinium dominans, G. jinhaense, and G. moestrupii in spring (March or April) (A), summer (June or July) (B), autumn (September or October) (C), and winter (December or January) (D) from 2015 to 2018 ( https://e-algae.org).
algae-2021-36-1-37-suppl.pdf
CONFLICTS OF INTEREST
CONFLICTS OF INTEREST
The authors declare that they have no potential conflicts of interest.
Fig. 1
Map showing the 28 sampling stations during the study period. SC, Sokcho; JMJ, Jumunjin; DH, Donghae; UJ, Uljin; PH, Pohang; US, Ulsan; BS, Busan; DDP, Dadaepo; MS, Masan; JH, Jinhae; TY, Tongyeong; YS, Yeosu; KY, Kwangyang; GH, Goheung; JAH, Jangheung; AS, Ansan; DAJ, Dangjin; MGP, Mageompo; SCN, Seocheon; KS, Kunsan; BA, Buan; MP, Mokpo; AW, Aewol; GS, Gosan; SGP, Seogwipo; WM, Wimi; SS, Seongsan; GN, Gimnyeong. 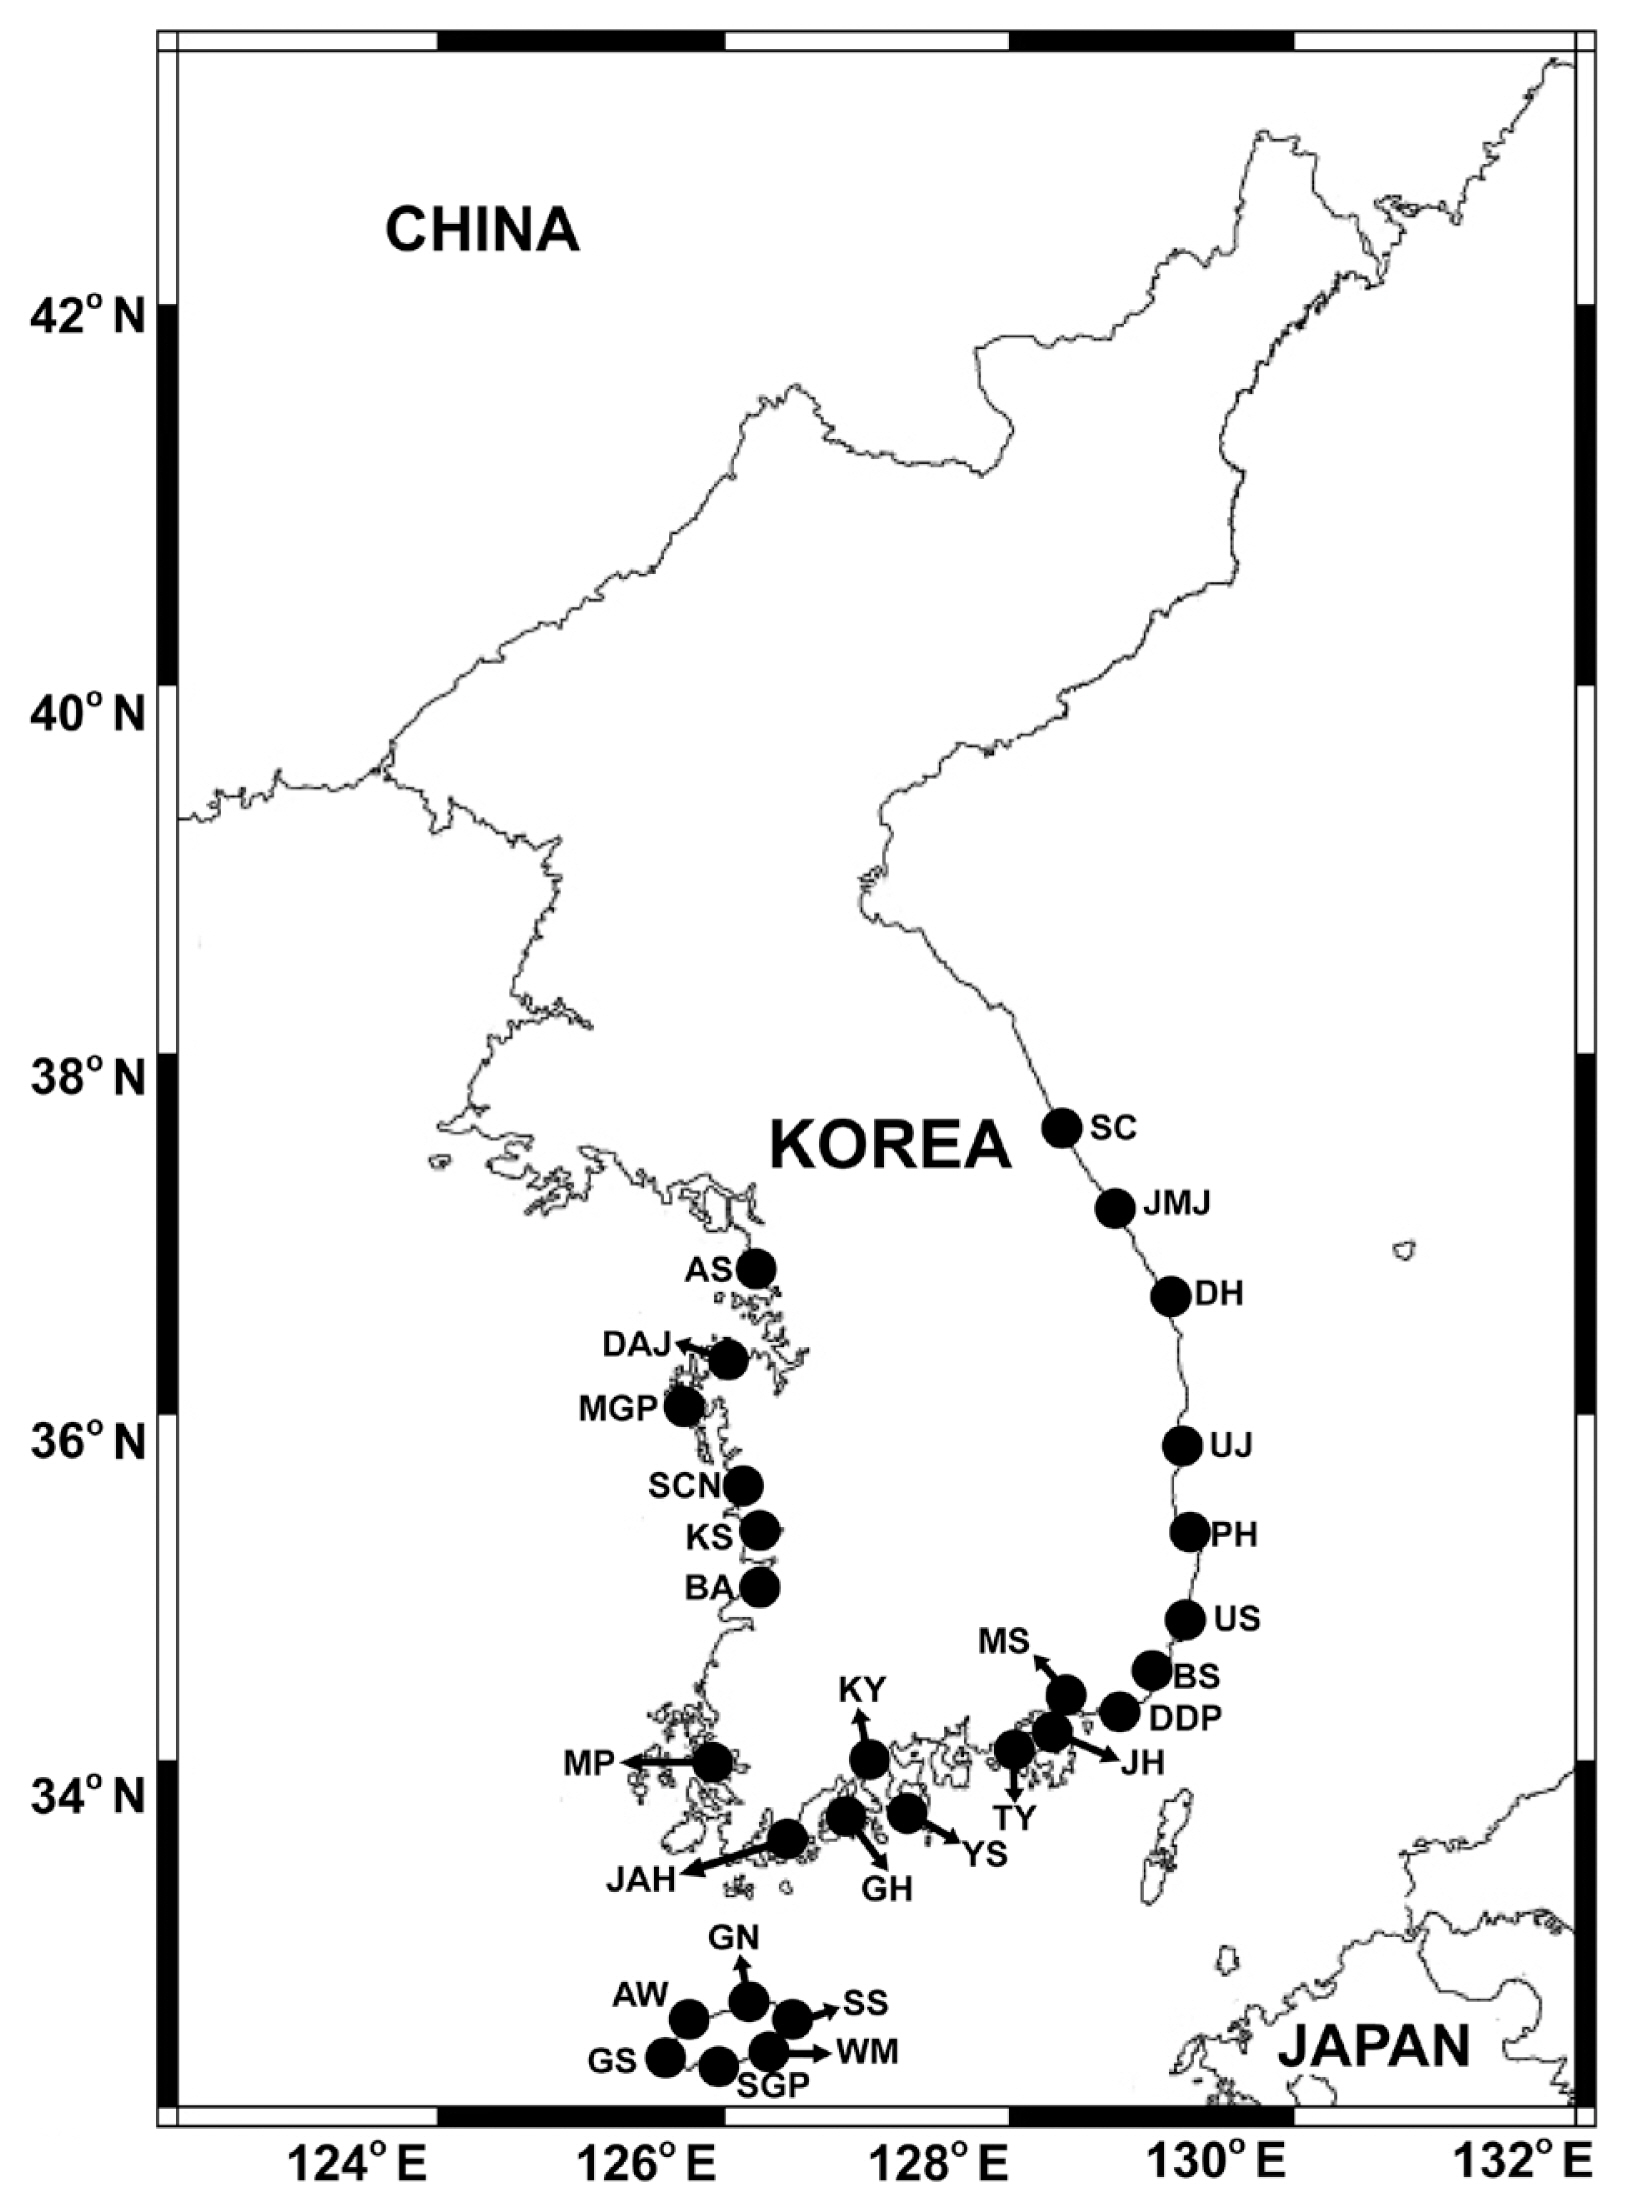
Fig. 2
Map of the sampling stations, indicating the presence and absence of Gyrodinium dominans, G. jinhaense, and G. moestrupii during the study period. The red, blue, and green circular sectors indicate the stations at which G. dominans, G. jinhaense, and G. moestrupii cells were detected, respectively, and the white circular sector indicates the stations at which Gyrodinium cells were not detected. SC, Sokcho; JMJ, Jumunjin; DH, Donghae; UJ, Uljin; PH, Pohang; US, Ulsan; BS, Busan; DDP, Dadaepo; MS, Masan; JH, Jinhae; TY, Tongyeong; YS, Yeosu; KY, Kwangyang; GH, Goheung; JAH, Jangheung; AS, Ansan; DAJ, Dangjin; MGP, Mageompo; SCN, Seocheon; KS, Kunsan; BA, Buan; MP, Mokpo; AW, Aewol; GS, Gosan; SGP, Seogwipo; WM, Wimi; SS, Seongsan; GN, Gimnyeong. 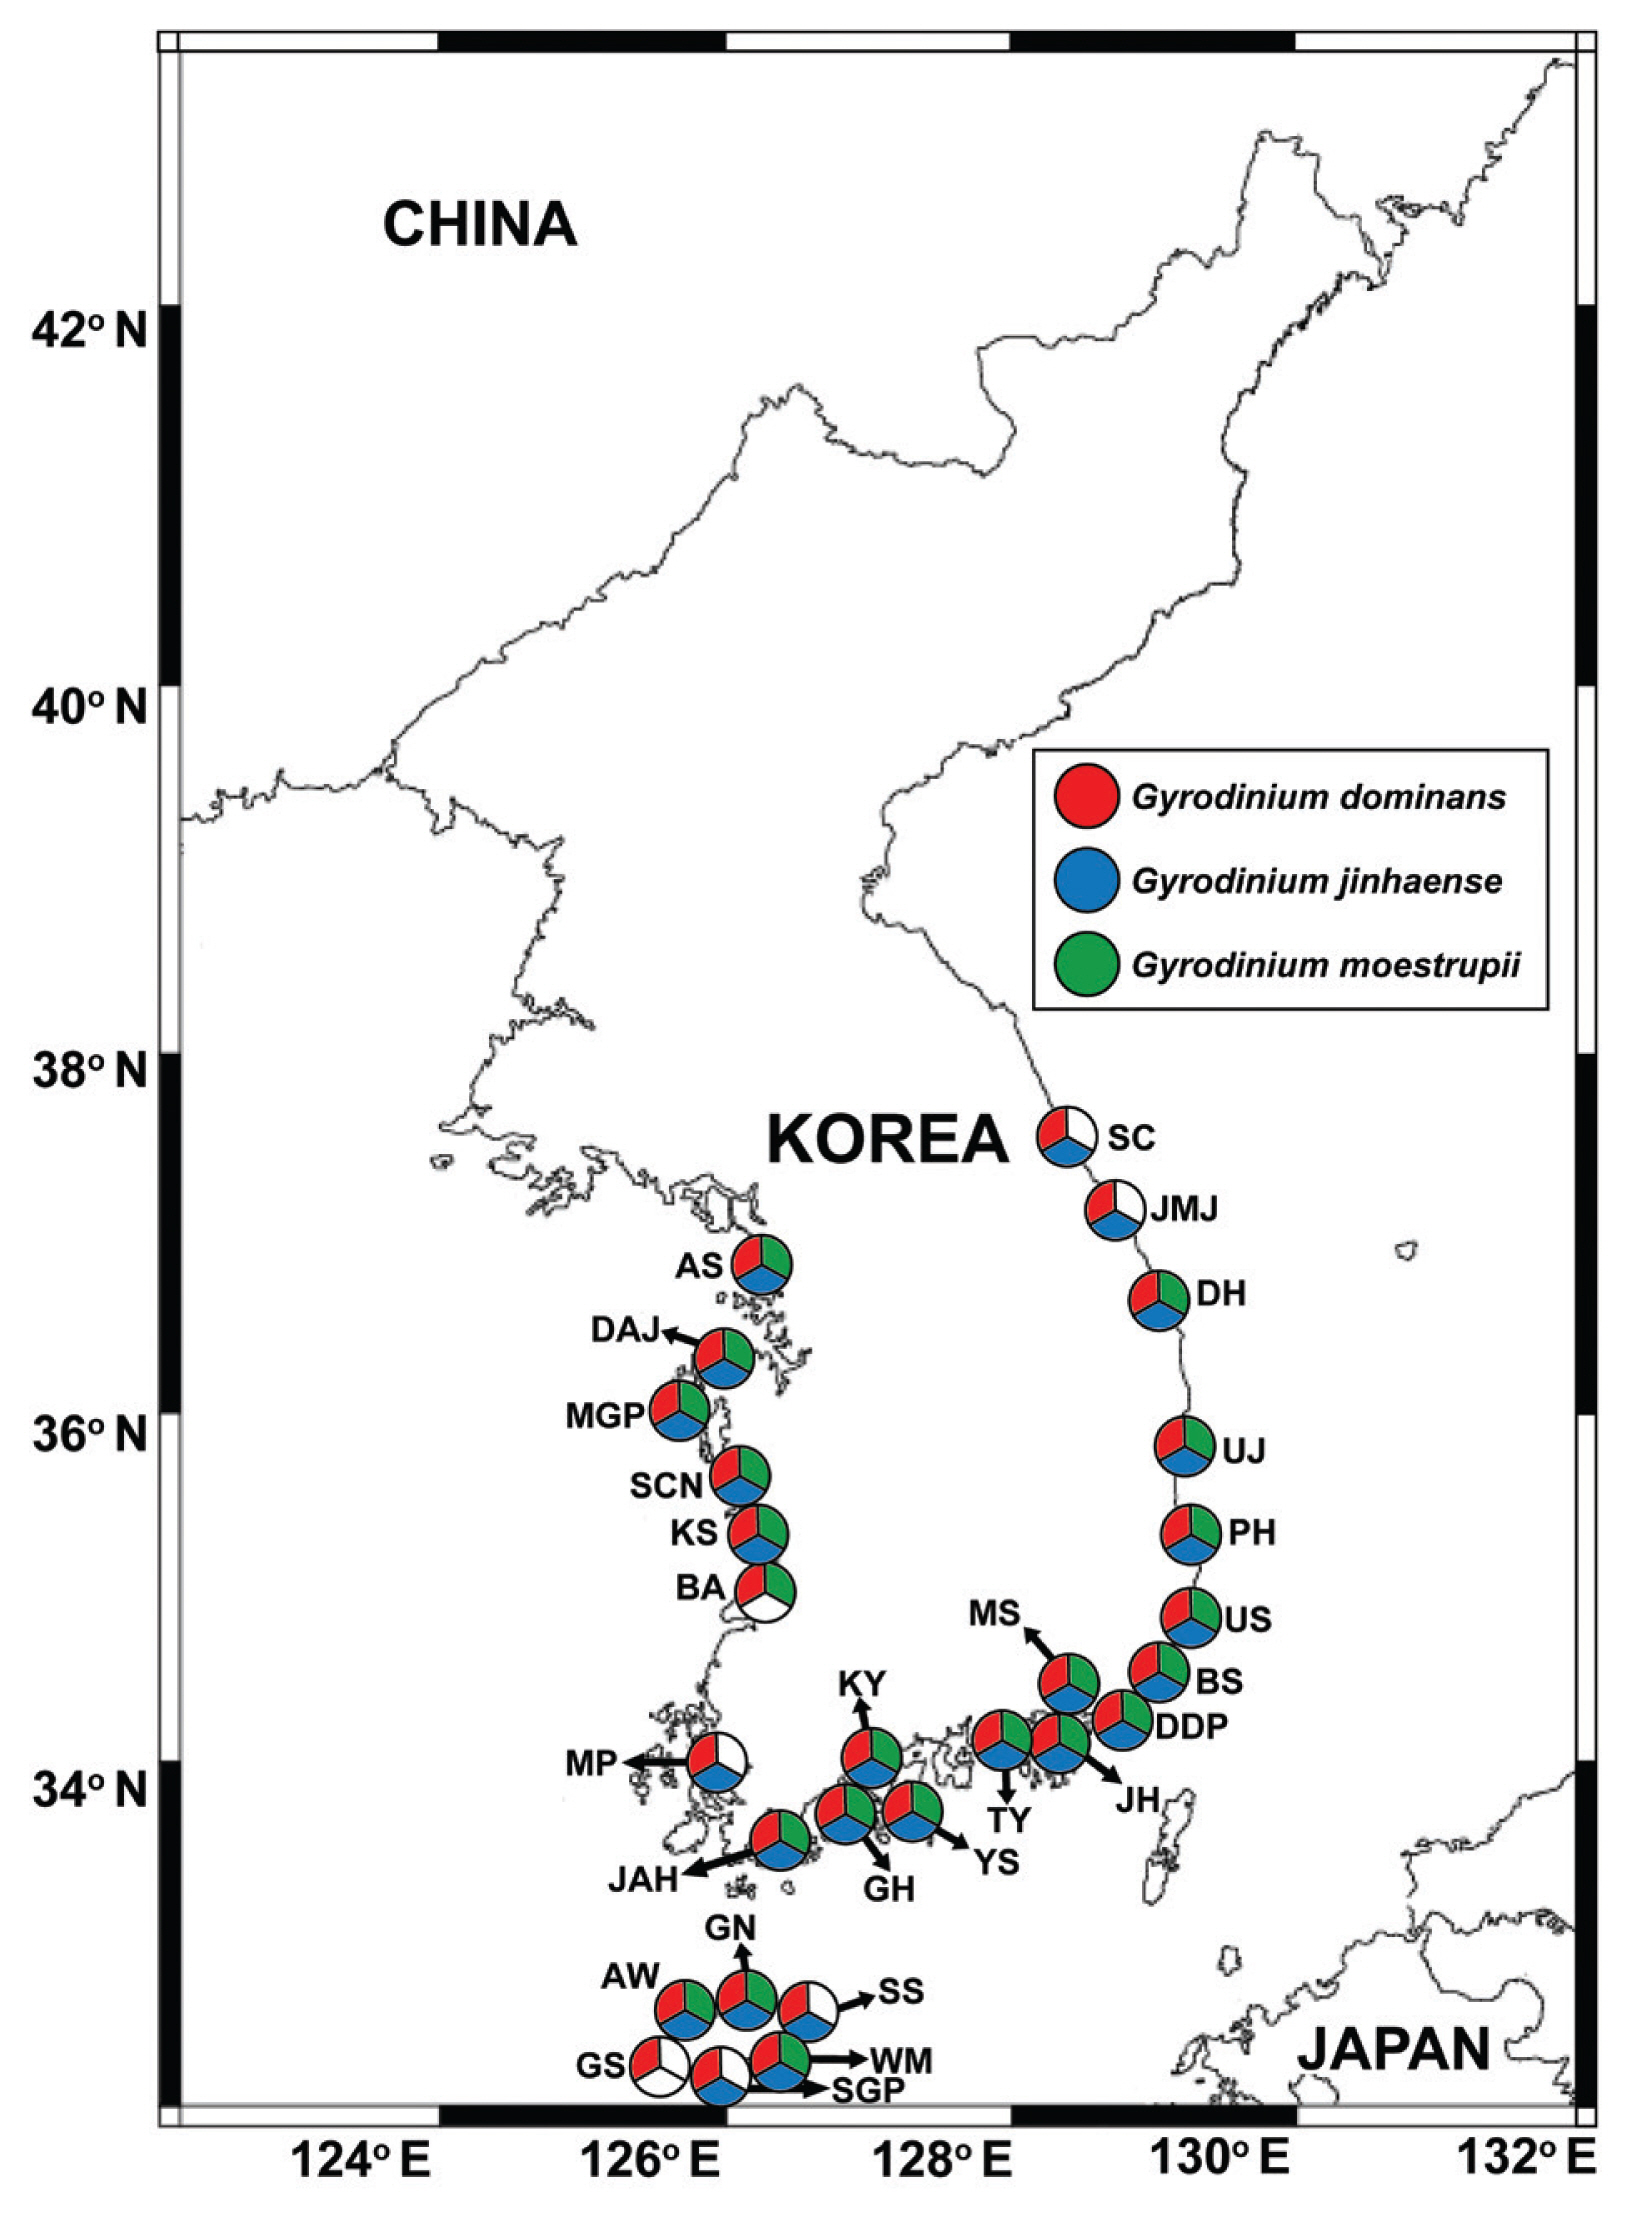
Fig. 3
Venn diagram of the presence of Gyrodinium dominans (Gdo), G. jinhaense (Gjin), and G. moestrupii (Gmoe) in the water samples collected from the 28 stations during the present study (n = 399). Absence of all three species in 128 samples. 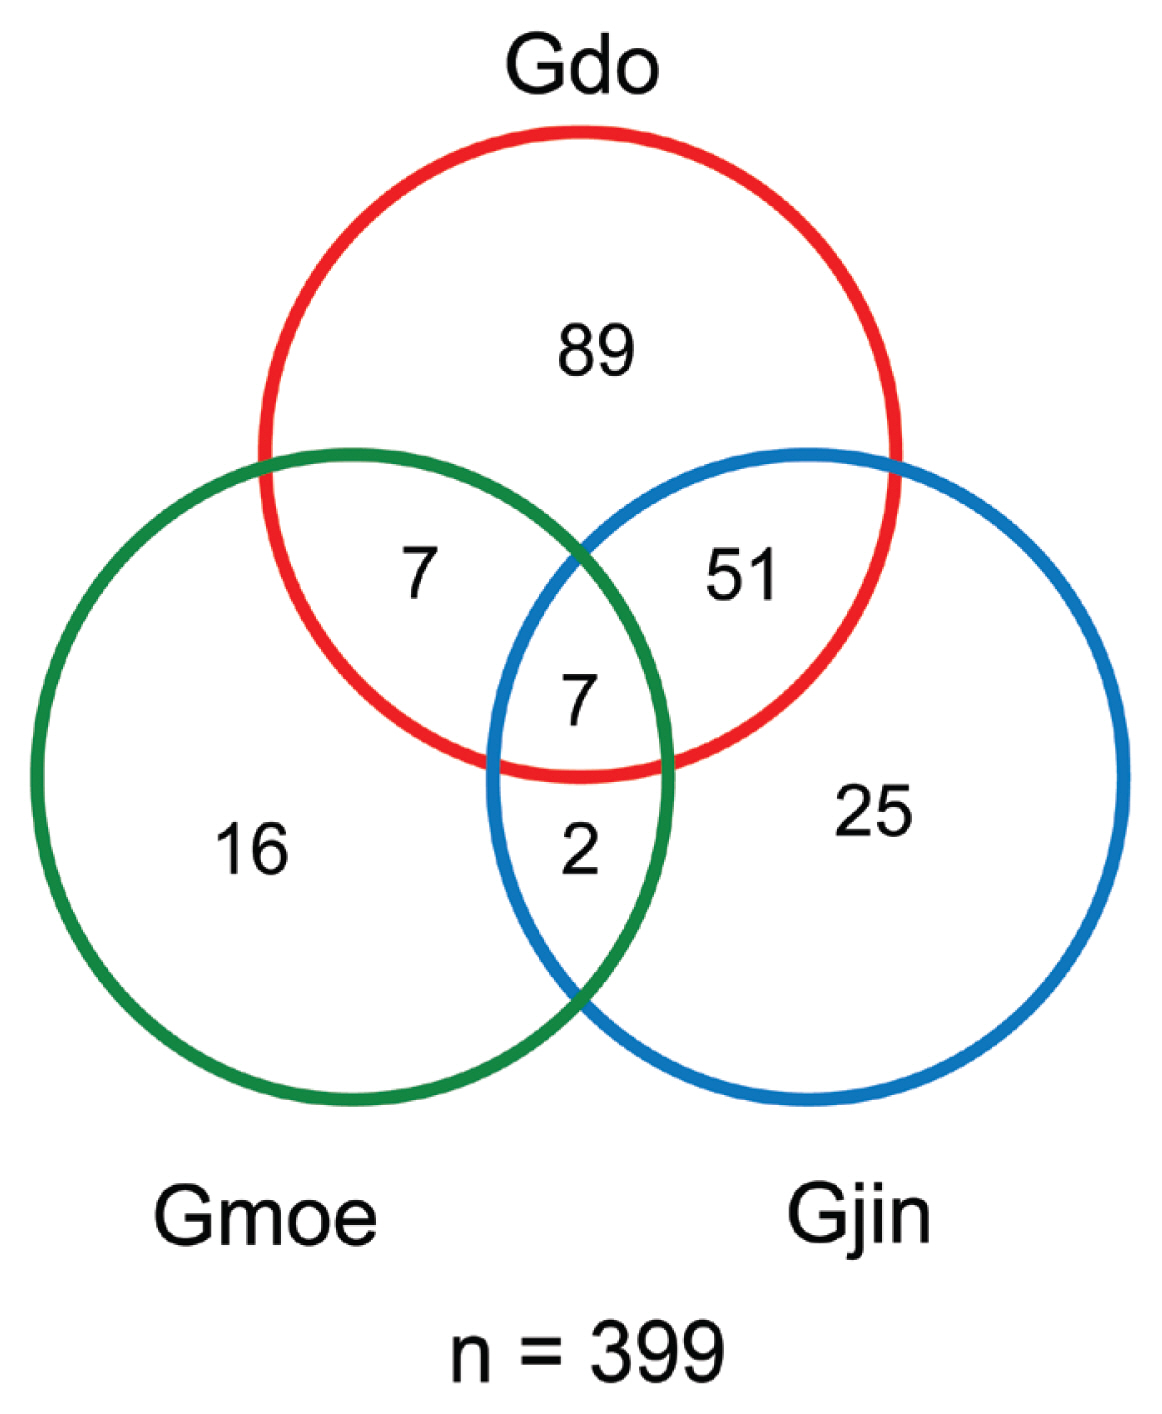
Fig. 4
Map of the sampling stations, indicating the presence and absence of Gyrodinium dominans in spring (March or April) (A), summer (June or July) (B), autumn (September or October) (C), and winter (December or January) (D) from 2015 to 2018. The red closed circles indicate the stations at which G. dominans cells were detected, whereas the black open circles indicate the stations at which G. dominans cells were not detected. The scale of the circles indicates the abundance of G. dominans cells (cells mL−1). SC, Sokcho; JMJ, Jumunjin; DH, Donghae; UJ, Uljin; PH, Pohang; US, Ulsan; BS, Busan; DDP, Dadaepo; MS, Masan; JH, Jinhae; TY, Tongyeong; YS, Yeosu; KY, Kwangyang; GH, Goheung; JAH, Jangheung; AS, Ansan; DAJ, Dangjin; MGP, Mageompo; SCN, Seocheon; KS, Kunsan; BA, Buan; MP, Mokpo; AW, Aewol; GS, Gosan; SGP, Seogwipo; WM, Wimi; SS, Seongsan; GN, Gimnyeong. 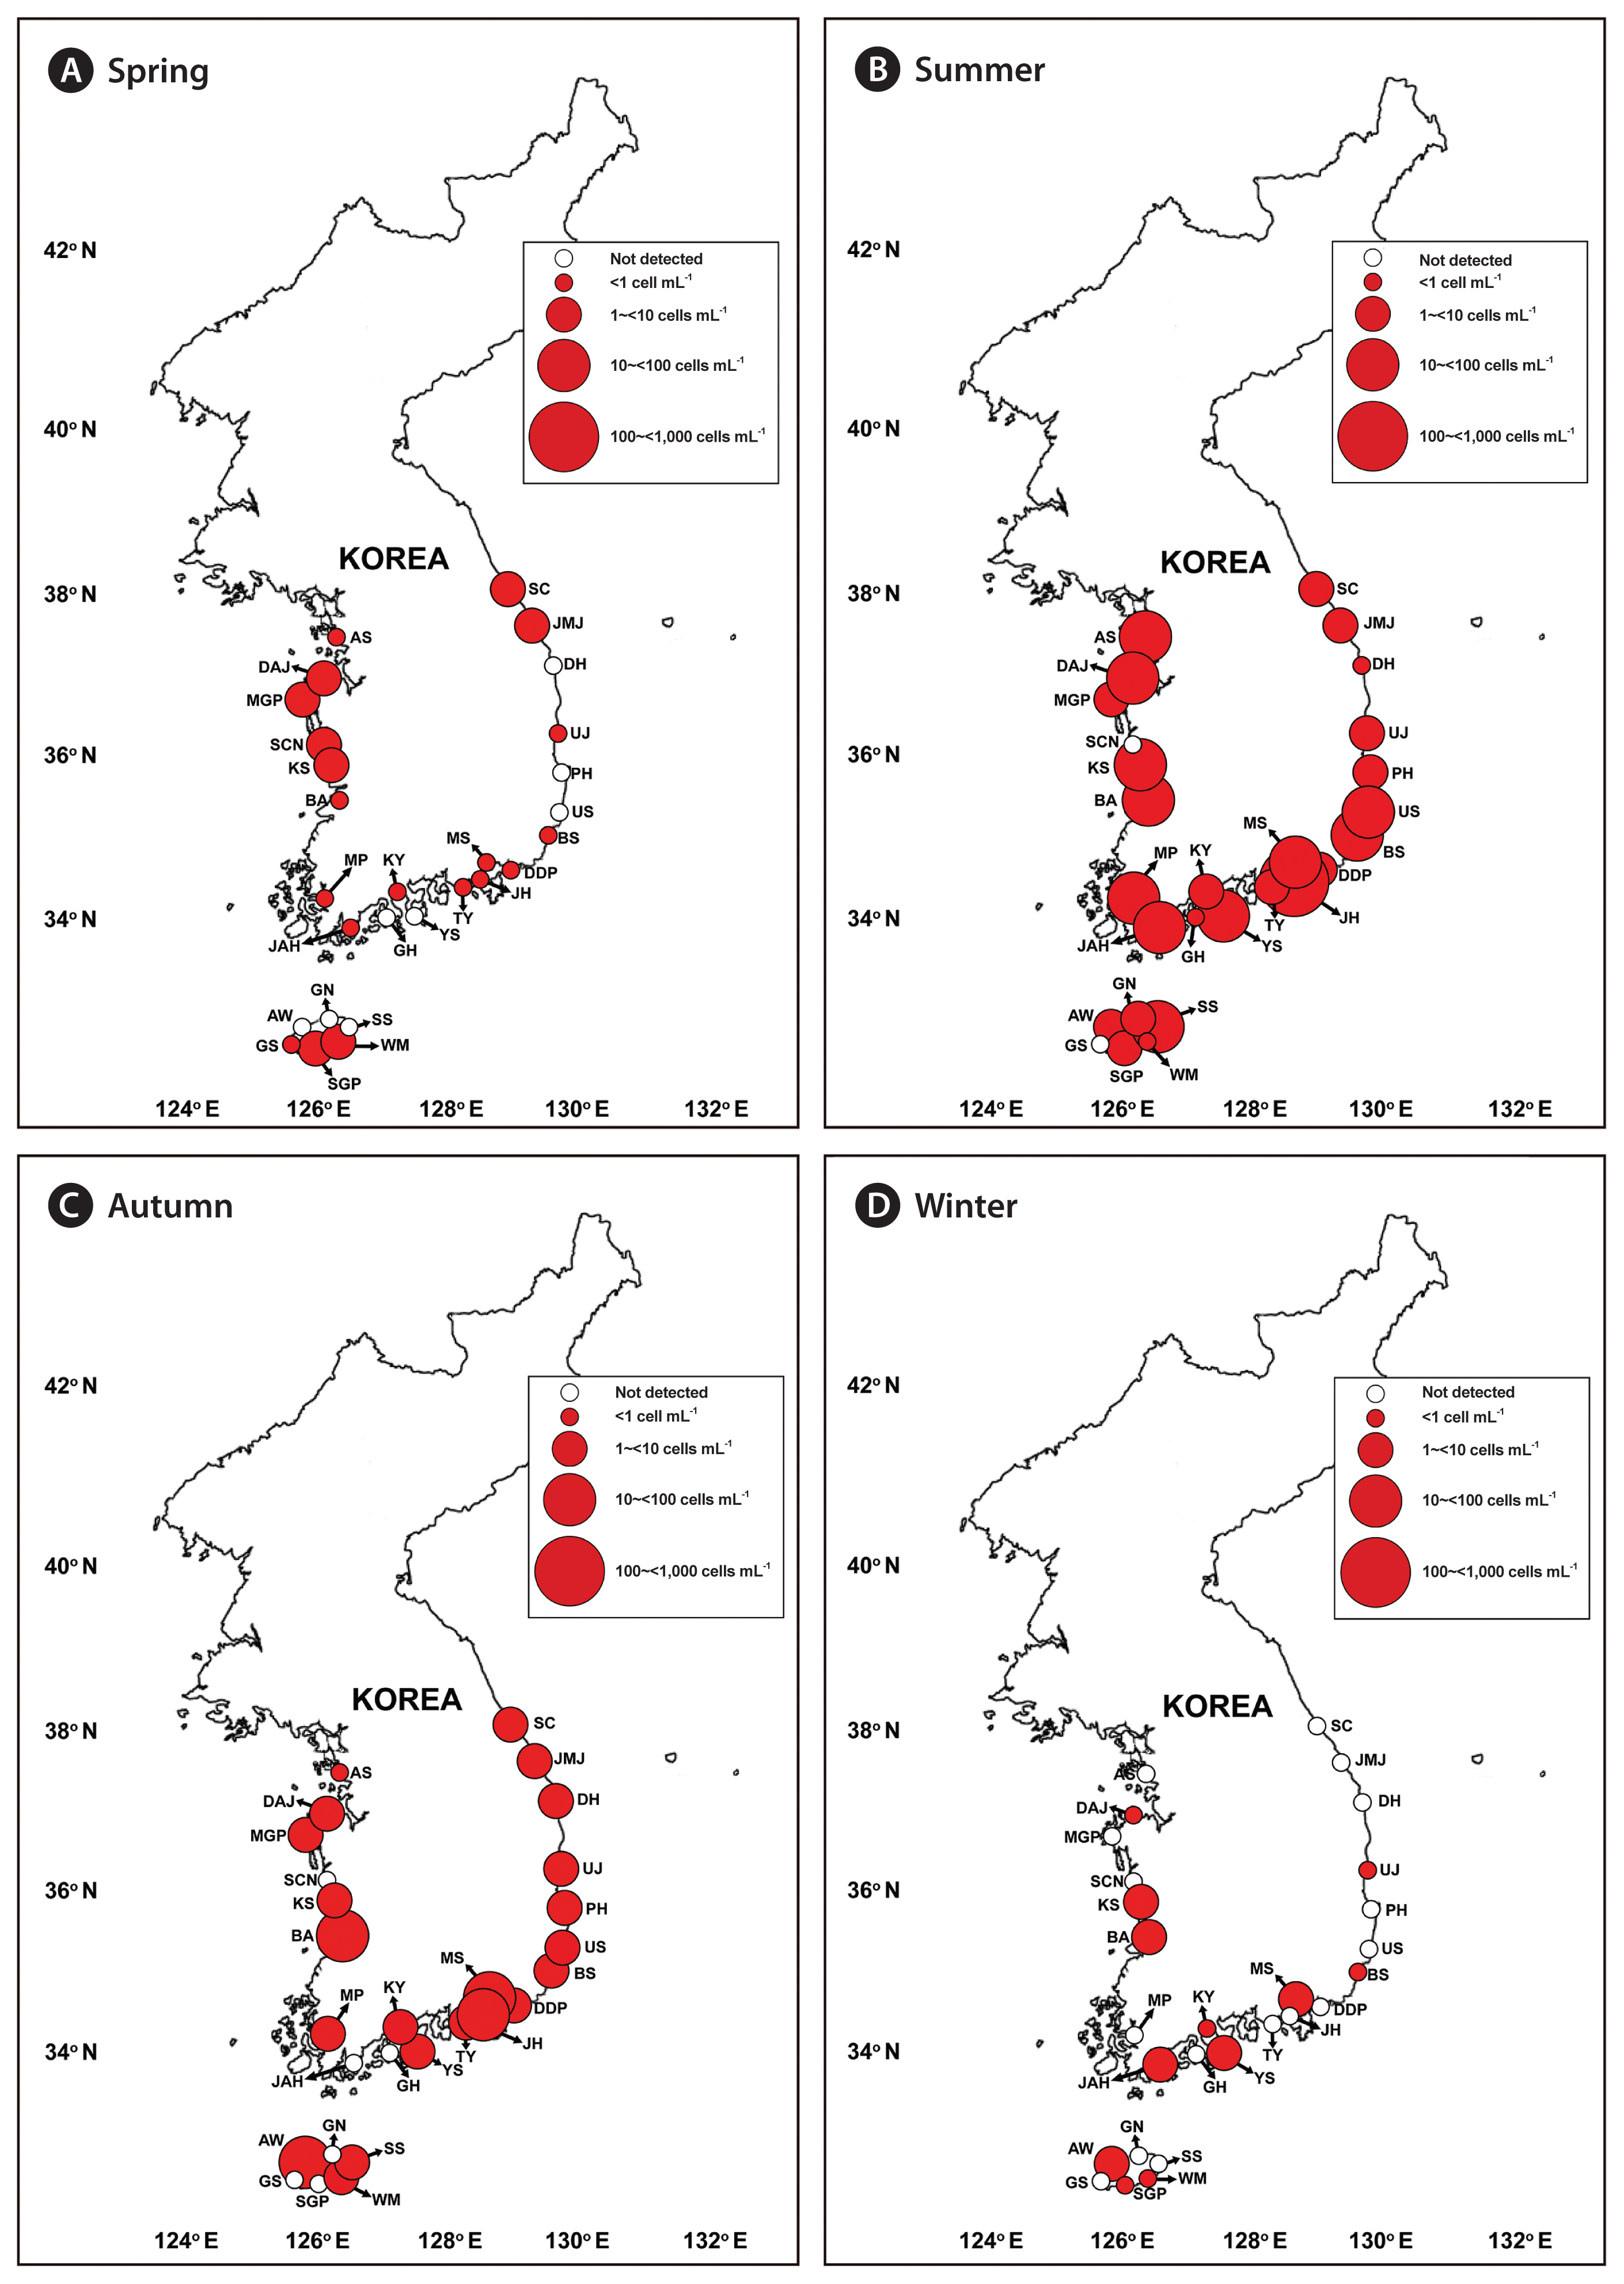
Fig. 5
Map of the sampling stations, indicating the presence and absence of Gyrodinium jinhaense in spring (March or April) (A), summer (June or July) (B), autumn (September or October) (C), and winter (December or January) (D) from 2015 to 2018. The blue closed circles indicate the stations at which G. jinhaense cells were detected, whereas the black open circles indicate the stations at which G. jinhaense cells were not detected. The scale of the circles indicates the abundance of G. jinhaense cells (cells mL−1). SC, Sokcho; JMJ, Jumunjin; DH, Donghae; UJ, Uljin; PH, Pohang; US, Ulsan; BS, Busan; DDP, Dadaepo; MS, Masan; JH, Jinhae; TY, Tongyeong; YS, Yeosu; KY, Kwangyang; GH, Goheung; JAH, Jangheung; AS, Ansan; DAJ, Dangjin; MGP, Mageompo; SCN, Seocheon; KS, Kunsan; BA, Buan; MP, Mokpo; AW, Aewol; GS, Gosan; SGP, Seogwipo; WM, Wimi; SS, Seongsan; GN, Gimnyeong. 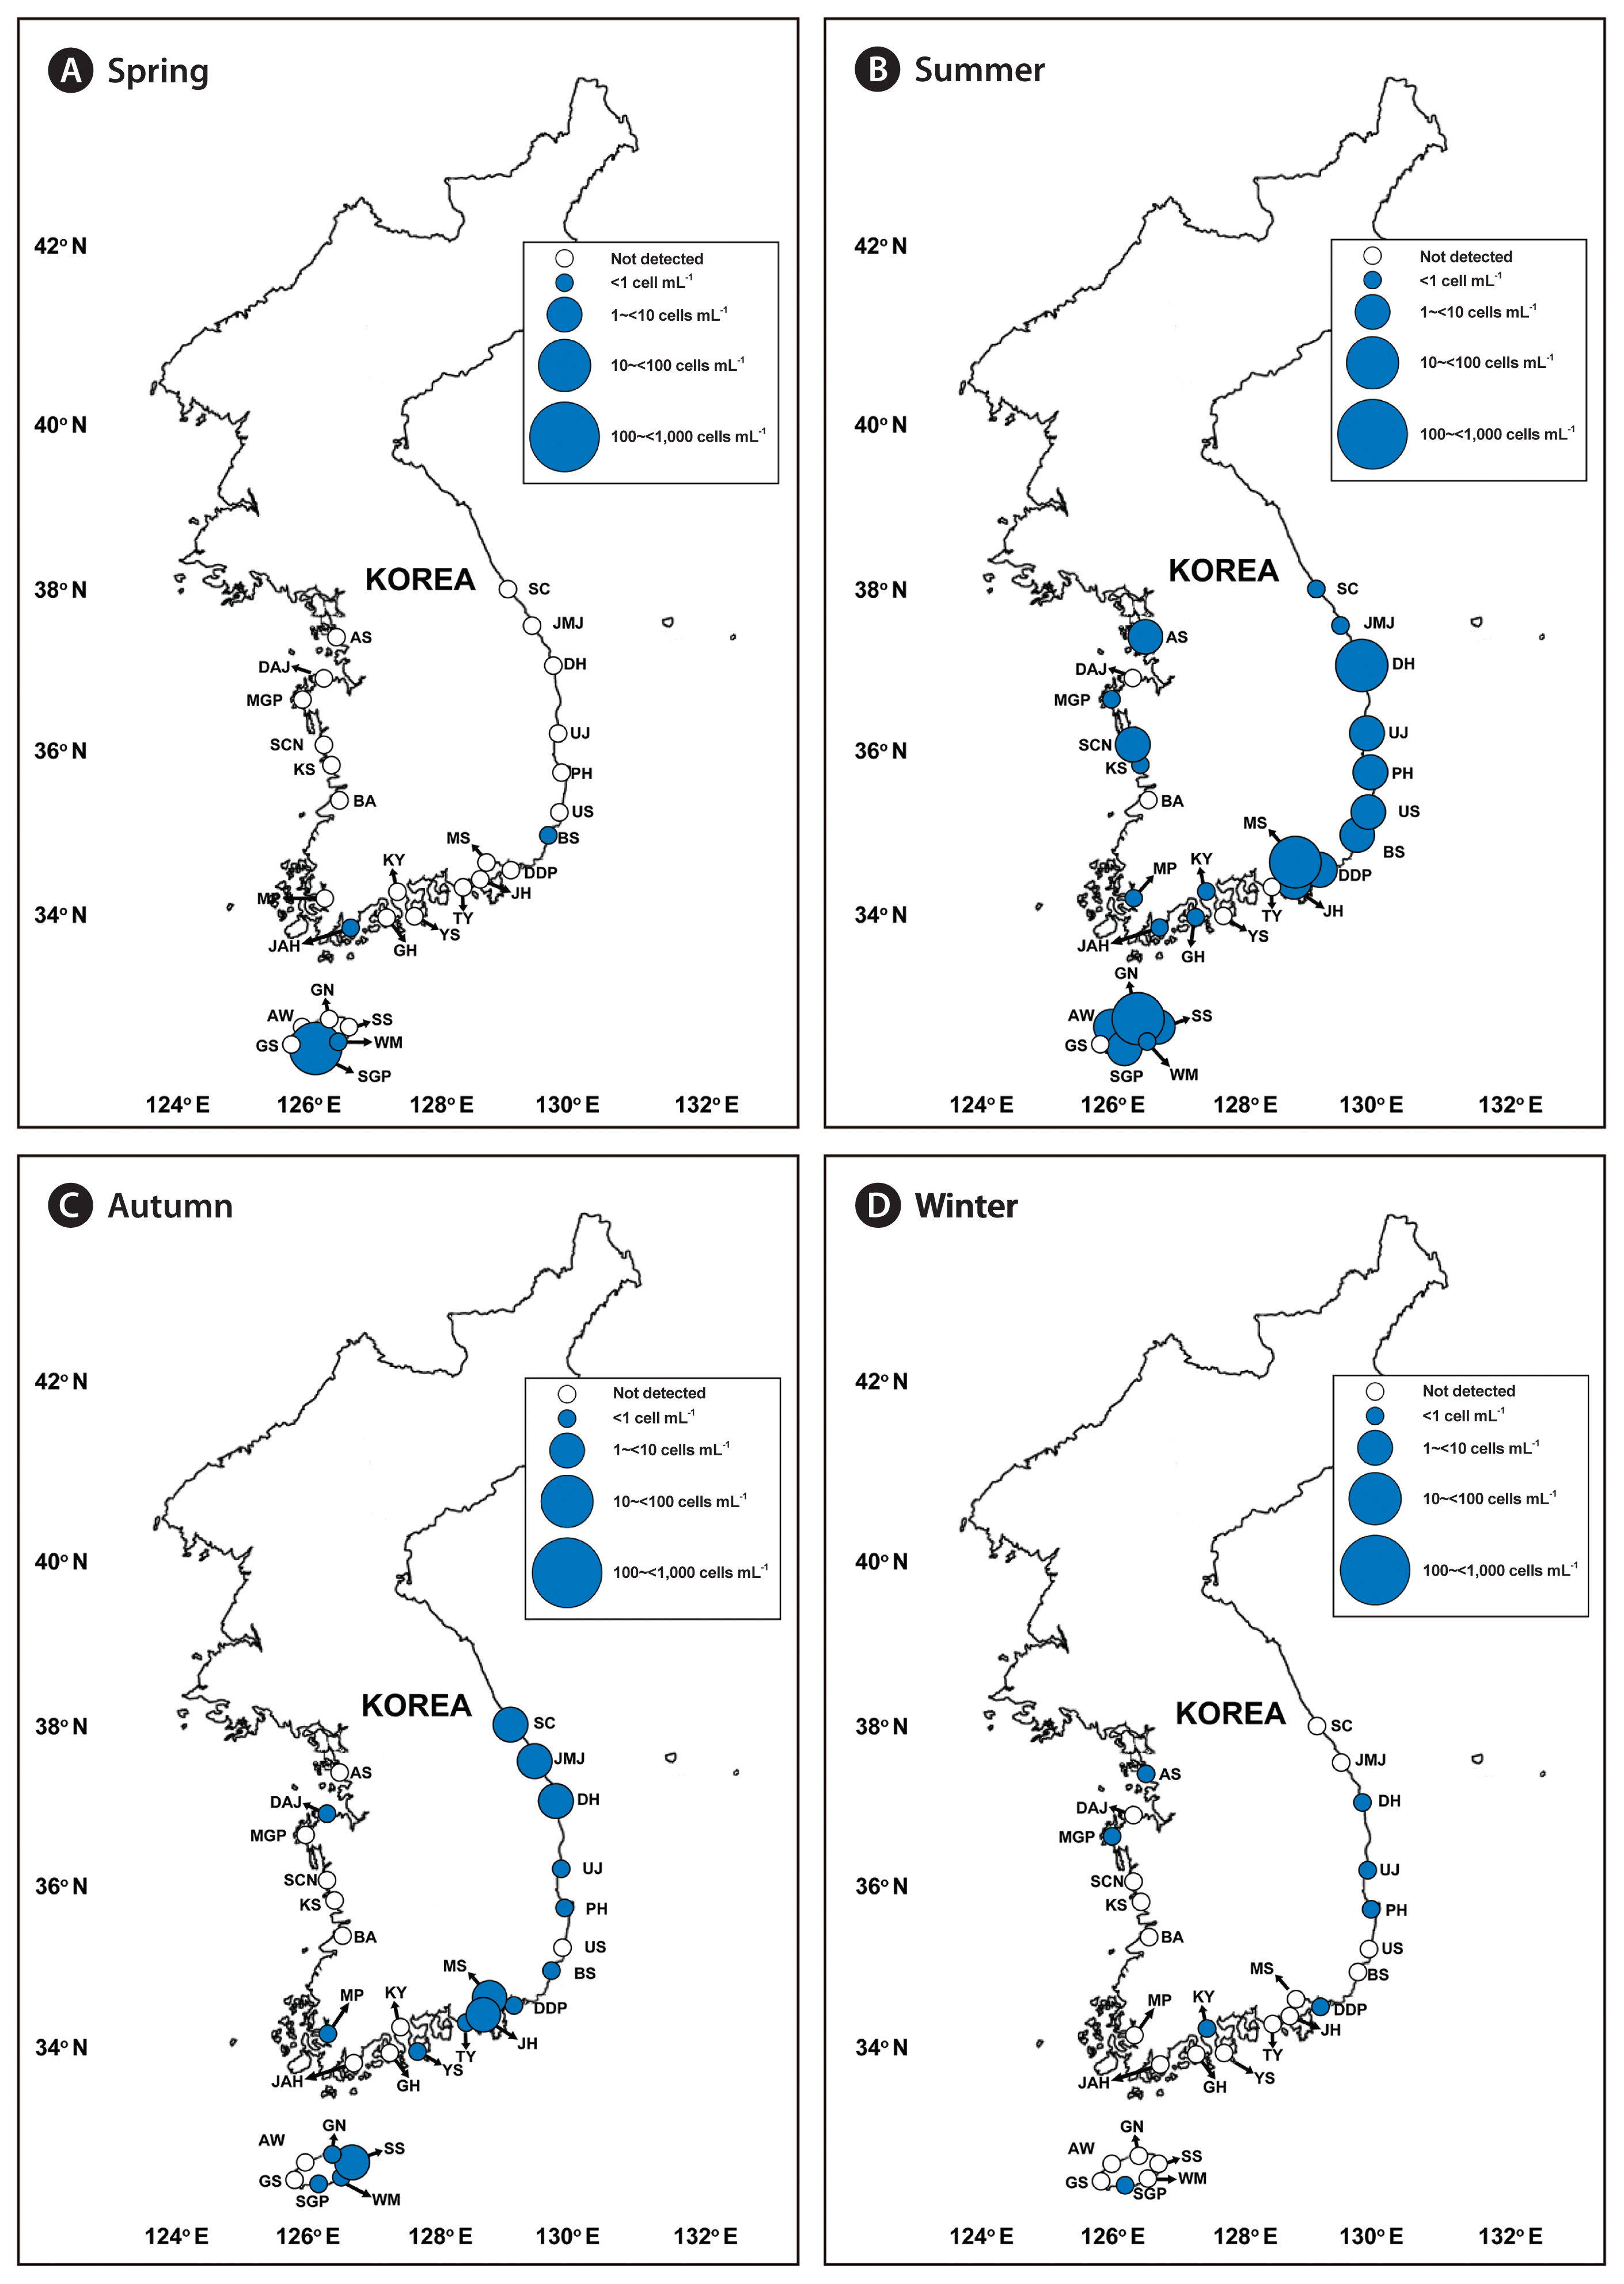
Fig. 6
Map of the sampling stations, indicating the presence and absence of Gyrodinium moestrupii in spring (March or April) (A), summer (June or July) (B), autumn (September or October) (C), and winter (December or January) (D) from 2015 to 2018. The green closed circles indicate the stations at which G. moestrupii cells were detected, whereas the black open circles indicate the stations at which G. moestrupii cells were not detected. The scale of the circles indicates the abundance of G. moestrupii cells (cells mL−1). SC, Sokcho; JMJ, Jumunjin; DH, Donghae; UJ, Uljin; PH, Pohang; US, Ulsan; BS, Busan; DDP, Dadaepo; MS, Masan; JH, Jinhae; TY, Tongyeong; YS, Yeosu; KY, Kwangyang; GH, Goheung; JAH, Jangheung; AS, Ansan; DAJ, Dangjin; MGP, Mageompo; SCN, Seocheon; KS, Kunsan; BA, Buan; MP, Mokpo; AW, Aewol; GS, Gosan; SGP, Seogwipo; WM, Wimi; SS, Seongsan; GN, Gimnyeong. 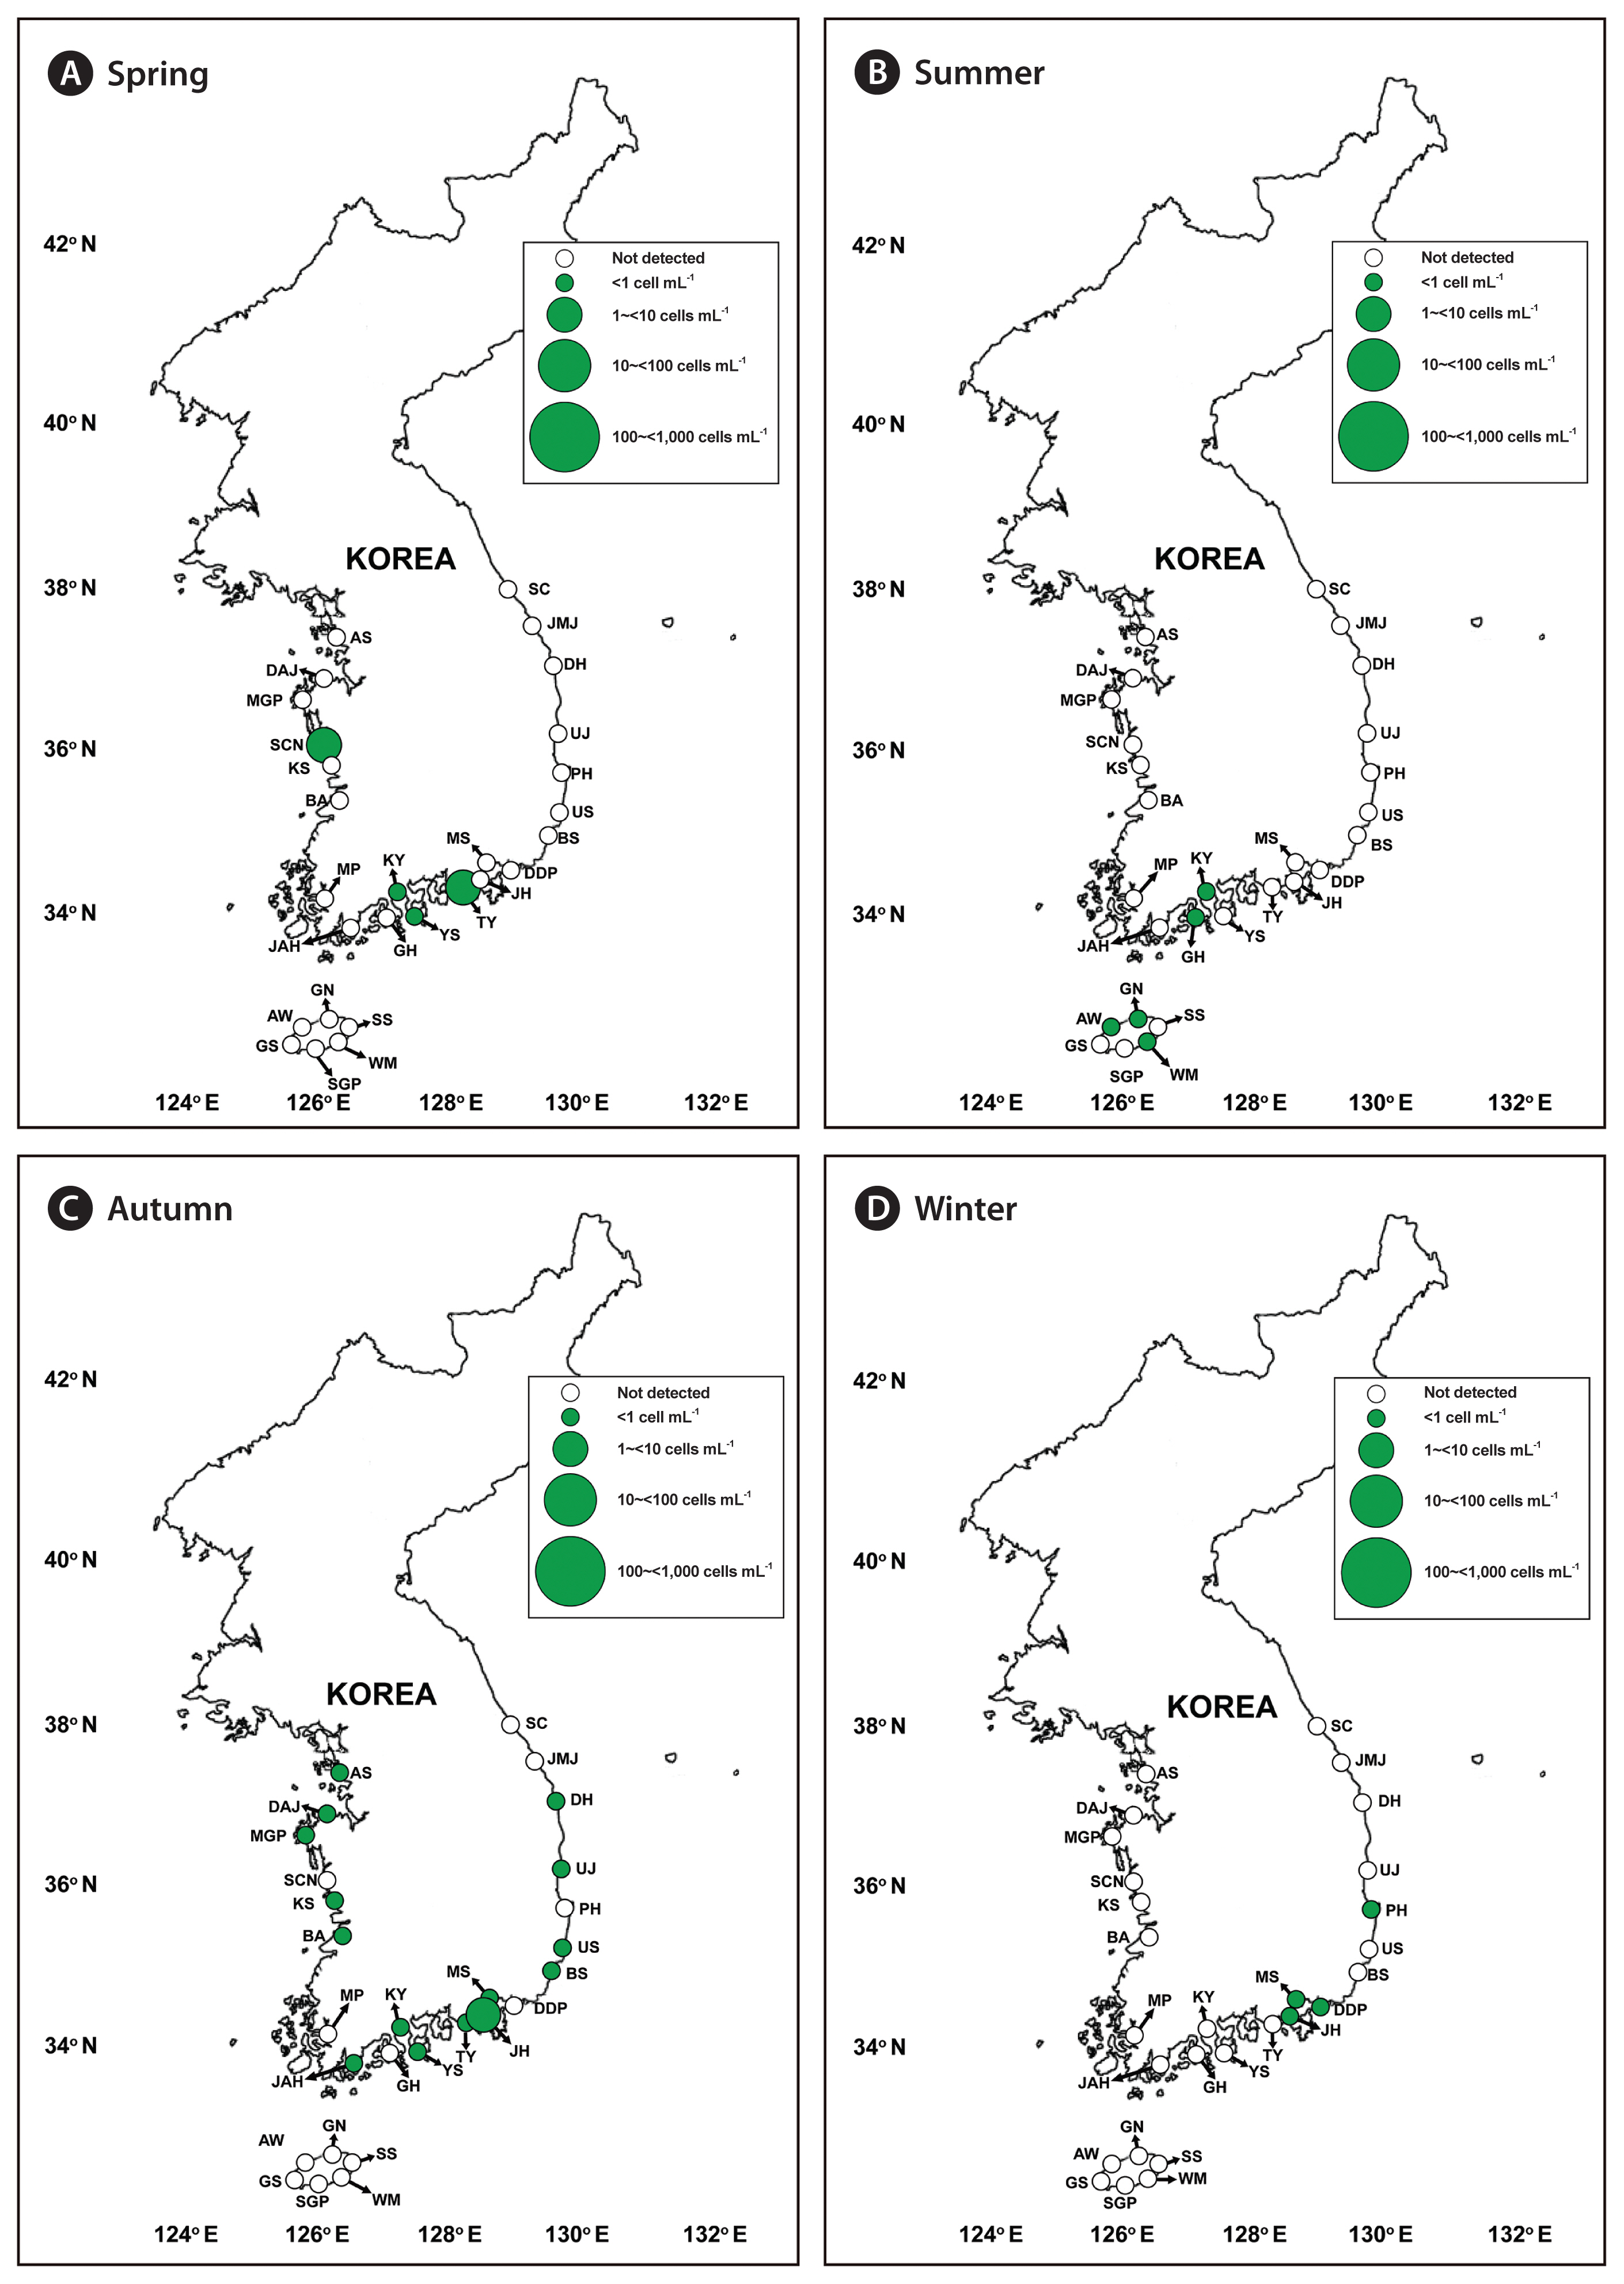
Fig. 7
Abundances (cells mL−1) of Gyrodinium dominans (Gdo) (A), Gyrodinium jinhaense (Gjin) (B), and Gyrodinium moestrupii (Gmoe) (C), as a function of water temperature (°C) and salinity at all stations from 2015 to 2018. The scale of the circles in the inset represents the abundance of each species (cells mL−1). 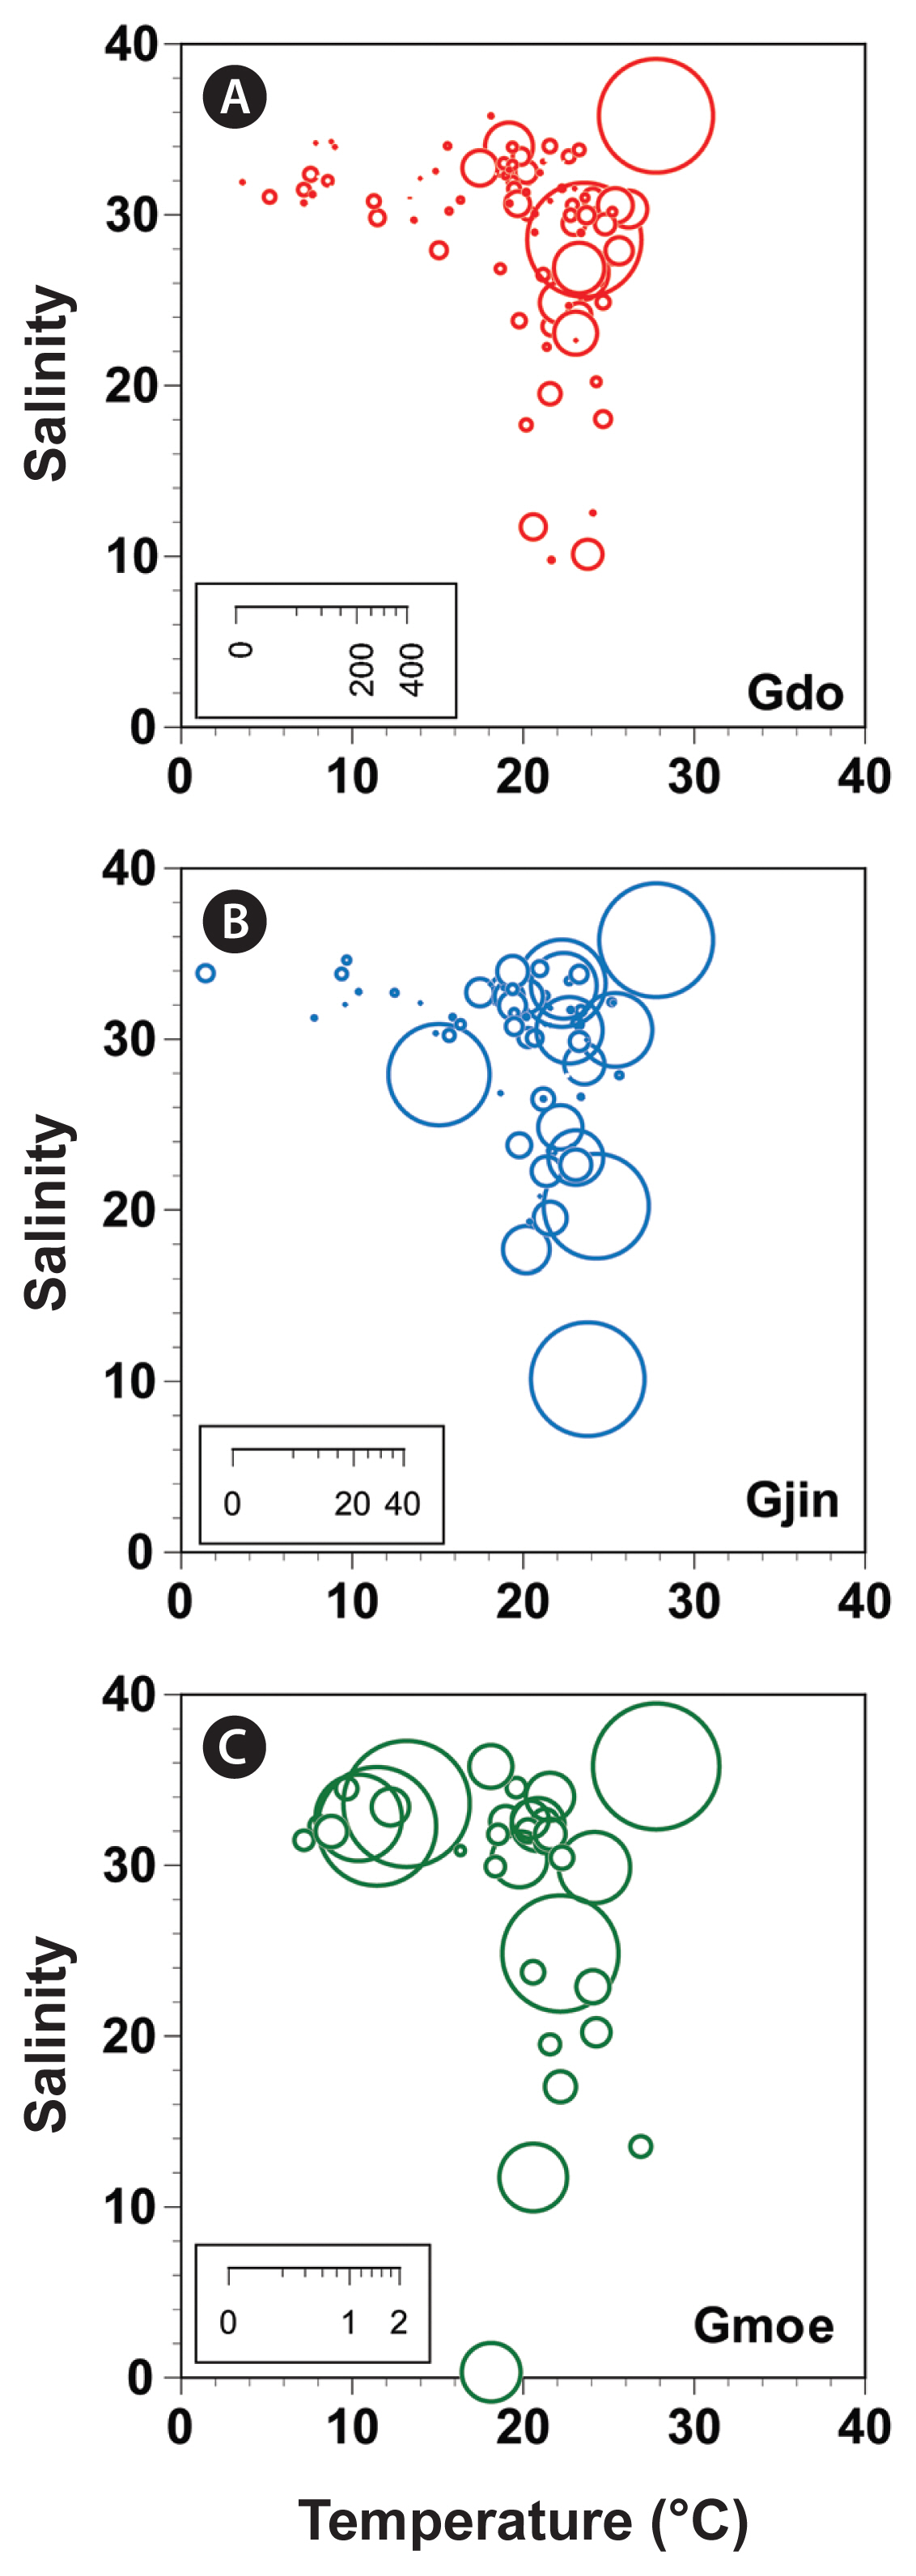
Fig. 8
Light micrographs of Gyrodinium dominans (A), G. jinhaense (B), and G. moestrupii (C). Living cells (left) and cells fixed in 4% Lugol’s solution (right). Scale bars represent: A–C, 10 μm. 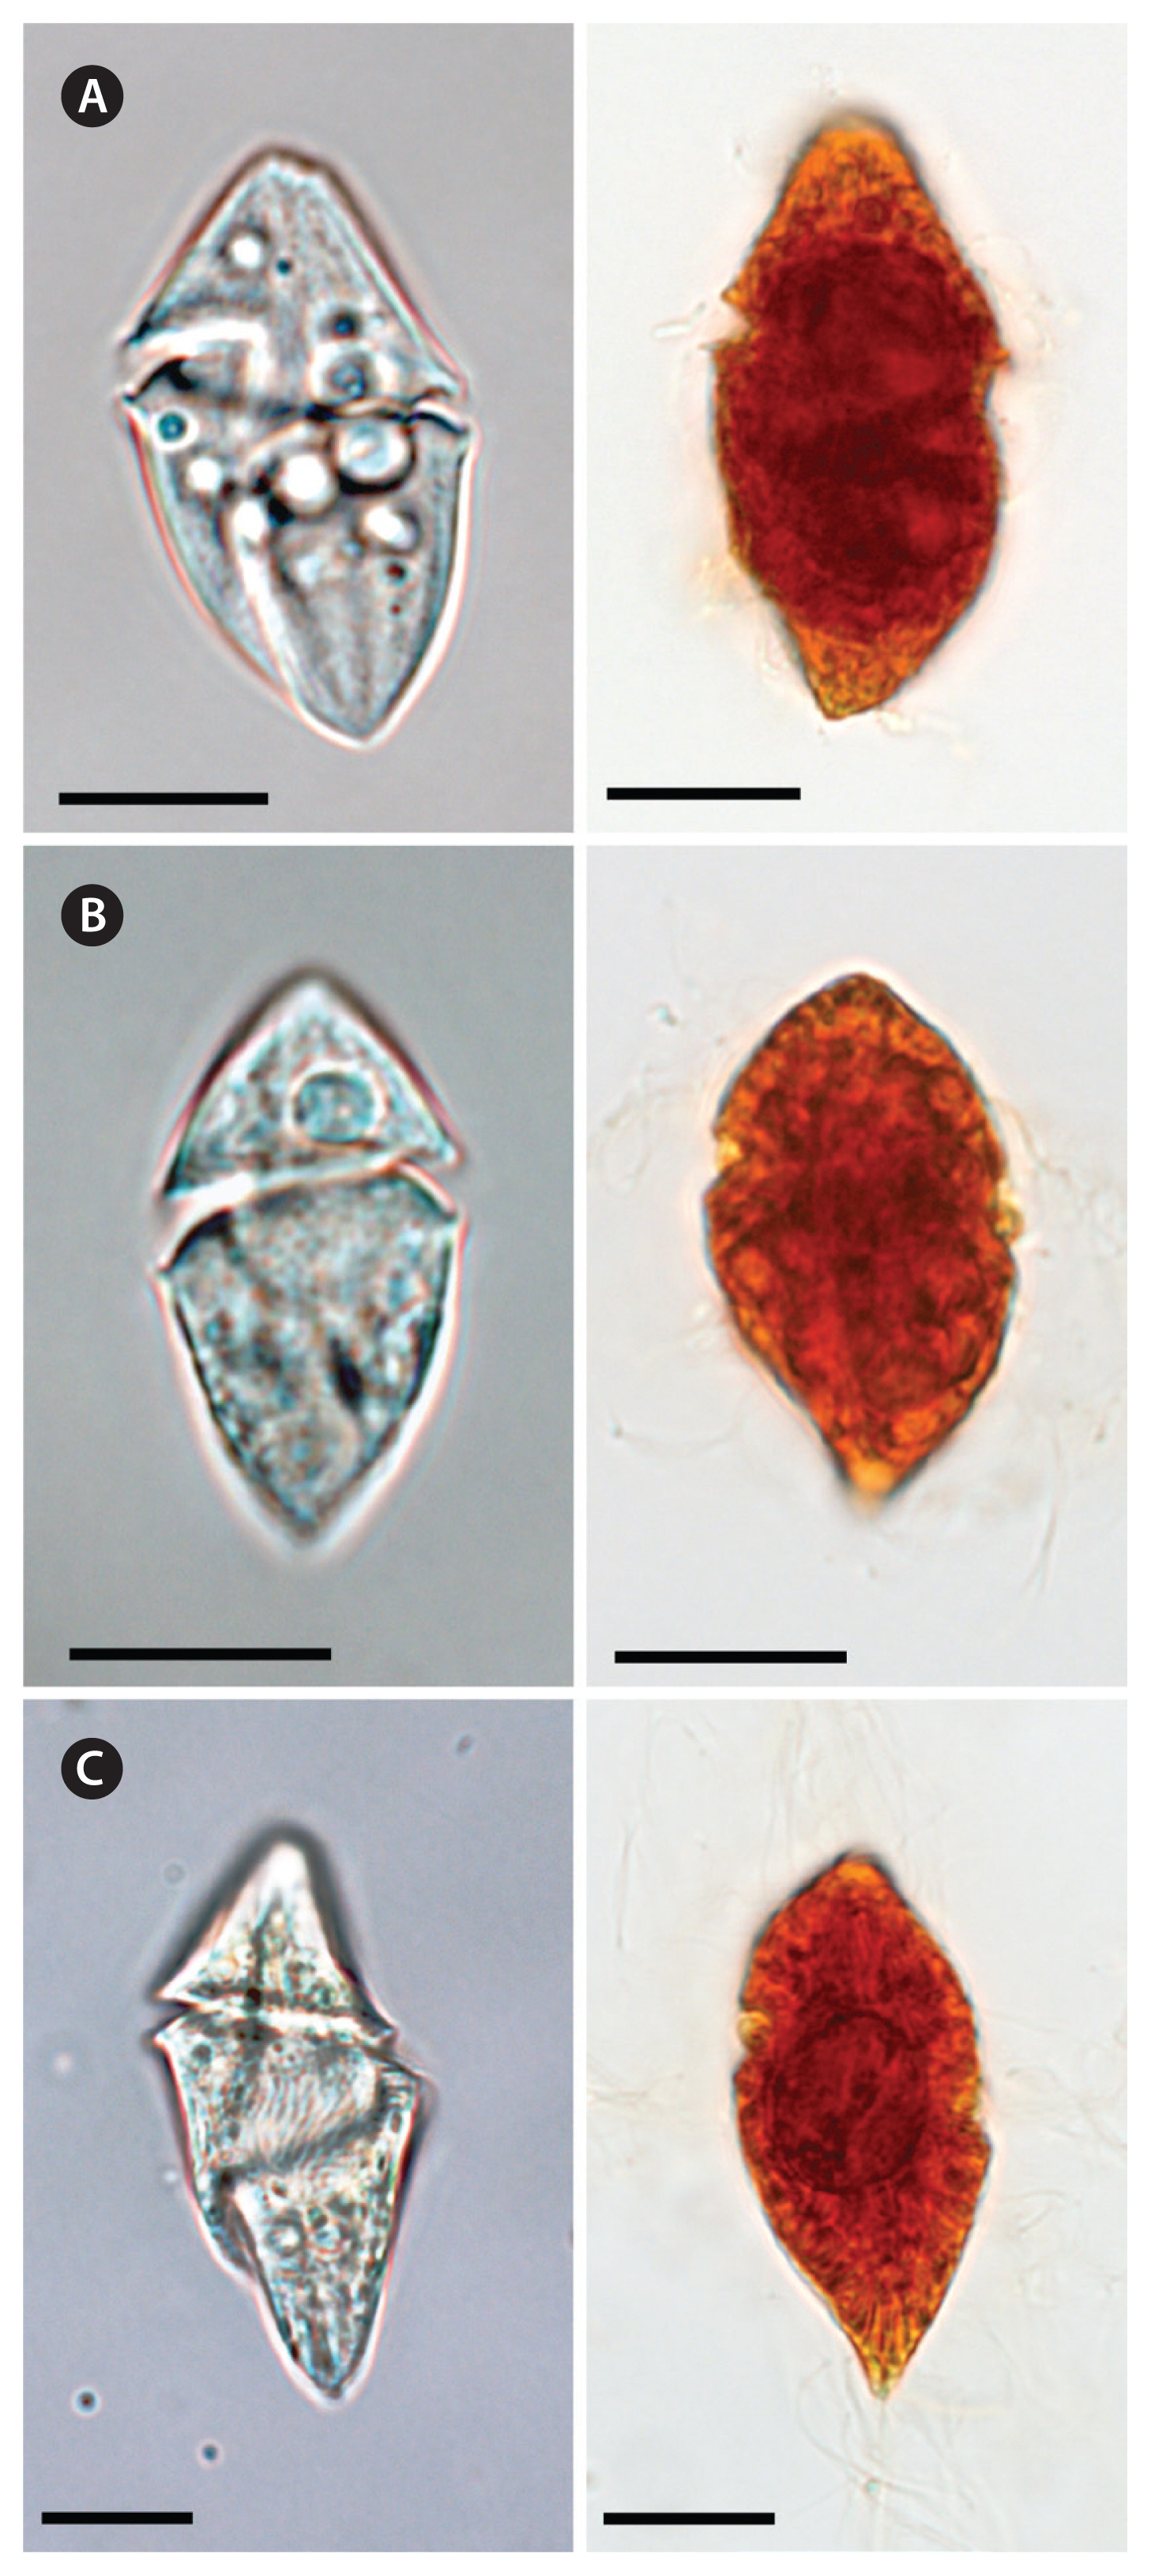
Table 1
Strain, location of collection (LC), collection date, water temperature (T, °C), and salinity (S) of Gyrodinium dominans (GDJK1907), Gyrodinium jinhaense (GSJH1710), and Gyrodinium moestrupii (GMSMK0910), isolated from the coastal waters off Korea
|
Species |
Strain |
LC |
Date |
T |
S |
|
Gyrodinium dominans
|
GDJK1907 |
Jeongok harbor, Korea |
Jul 2019 |
25.2 |
31.9 |
|
Gyrodinium jinhaense
|
GSJH1710 |
Jinhae Bay, Korea |
Oct 2017 |
21.6 |
32.5 |
|
Gyrodinium moestrupii
|
GMSMK0910 |
Saemangeum, Korea |
Oct 2009 |
21.2 |
31.0 |
Table 2
Oligonucleotide primers used to amplify the internal transcribed spacer (ITS1, 5.8S, ITS2) regions of ribosomal DNA and the species-specific primers and TaqMan probes used to quantify the abundance of Gyrodinium dominans (Gdo), Gyrodinium jinhaense (Gjin), and Gyrodinium moestrupii (Gmoe), using qPCR
|
Target species |
Analysis |
Primer name |
Direction |
Primer region |
Primer sequence (5′-3′) |
Reference |
|
Gdo, Gjin, Gmoe |
PCR |
Euk1209F |
Forward |
SSU-ITS |
GGGCATCACAGACCTG |
Giovannoni et al. (1988)
|
|
Gdo, Gjin, Gmoe |
PCR |
ITSR2 |
Reverse |
ITS |
TCCCTGTTCATTCGCCATTAC |
Litaker et al. (2003)
|
|
Gdo |
qPCR |
Gdominans_F |
Forward |
ITS |
GAGCTTCATGCCCTTGATGCATC |
This study |
|
qPCR |
Gdominans_R |
Reverse |
ITS |
AAGCTCCGATGAAAGCAGAG |
This study |
|
qPCR |
Gdominans_P |
Probe |
ITS |
[FAM] GCGAGCAACTAACAGAACGCCTTCTG [BHQ1] |
This study |
|
Gjin |
qPCR |
Gjinhaense_IF |
Forward |
ITS |
TGTCTATTCCTGCCTCATGC |
This study |
|
qPCR |
Gjinhaense_IR |
Reverse |
ITS |
TTGTAAGGAAAGCTCACTGCAC |
This study |
|
qPCR |
Gjinhaense_IP |
Probe |
ITS |
[FAM] AGGAGCCTGTGGTGCCCCTGATG [BHQ1] |
This study |
|
Gmoe |
qPCR |
Gmoestrupii_F |
Forward |
ITS |
ATTCAATGCAGTGAGCTTCG |
This study |
|
qPCR |
Gmoestrupii_R |
Reverse |
ITS |
AGGCACCGACGAGTACGA |
This study |
|
qPCR |
Gmoestrupii_P |
Probe |
ITS |
[FAM] CTTGCGAGCATCTAACAGAACGCCTTT [BHQ1] |
This study |
Table 3
Ranges of the measured abiotic environmental factors during the study period and when Gyrodinium dominans, Gyrodinium jinhaense, and Gyrodinium moestrupii were detected in Korean coastal waters from April 2015 to October 2018
|
Species |
Temperature (°C) |
Salinity |
|
In this study period |
0.2–28.0 |
0.1–35.6 |
|
Gyrodinium dominans
|
3.8–26.4 |
9.6–35.6 |
|
Gyrodinium jinhaense
|
1.7–25.8 |
9.9–34.4 |
|
Gyrodinium moestrupii
|
7.4–27.1 |
0.1–35.6 |
Table 4
Pearson’s correlation coefficients for the relationships between the abundances (cells mL−1) of Gyrodinium dominans (Gdo), Gyrodinium jinhaense (Gjin), and Gyrodinium moestrupii (Gmoe) and environmental factors during the study period
|
Species |
Gdo |
Gjin |
Gmoe |
Chl-a
|
T |
S |
|
Gdo |
- |
0.195**
|
0.053 |
0.548**
|
0.167**
|
−0.128*
|
|
Gjin |
0.195**
|
- |
0.038 |
0.052 |
0.161**
|
−0.244**
|
|
Gmoe |
0.053 |
0.038 |
- |
−0.008 |
0.022 |
−0.102*
|
REFERENCES
Anderson, SR. & Menden-Deuer, S. 2017. Growth, grazing, and starvation survival in three heterotrophic dinoflagellate species. J Eukaryot Microbiol. 6:213–225.  Baker, AC. 2003. Flexibility and specificity in coral-algal symbiosis: diversity, ecology, and biogeography of Symbiodinium
. Ann Rev Ecol Evol Syst. 34:661–689. Burkholder, JM., Glibert, PM. & Skelton, HM. 2008. Mixotrophy, a major mode of nutrition for harmful algal species in eutrophic waters. Harmful Algae. 8:77–93. Buskey, EJ., Coulter, CJ. & Brown, SL. 1994. Feeding, growth and bioluminescence of the heterotrophic dinoflagellate Protoperidinium huberi
. Mar Biol. 121:373–380. Daugbjerg, N., Hansen, G., Larsen, J. & Moestrup, Ø. 2000. Phylogeny of some of the major genera of dinoflagellates based on ultrastructure and partial LSU rDNA sequence data, including the erection of three new genera of unarmoured dinoflagellates. Phycologia. 39:302–317. Gifford, DJ. & Dagg, MJ. 1991. The microzooplankton-mesozooplankton link: consumption of planktonic protozoa by the calanoid copepods Acartia tonsa Dana and Neocalanus plumchrus Mur ukawa. Mar. Microb. Food Webs. 5:161–177.
Giovannoni, SJ., DeLong, EF., Olsen, GJ. & Pace, NR. 1988. Phylogenetic group-specific oligodeoxynucleotide probes for identification of single microbial cells. J Bacteriol. 170:720–726. Hansen, PJ. 1991. Quantitative importance and trophic role of heterotrophic dinoflagellates in a coastal pelagial food web. Mar Ecol Prog Ser. 73:253–261. Hansen, PJ. 2011. The role of photosynthesis and food uptake for the growth of marine mixotrophic dinoflagellates. J Eukaryot Microbiol. 58:203–214. Hansen, G. & Daugbjerg, N. 2004. Ultrastructure of Gyrodinium spirale, the type species of Gyrodinium (Dinophyceae), including a phylogeny of G. dominans, G. rubrum and G. spirale deduced from partial LSU rDNA sequences. Protist. 155:271–294. Jang, SH. & Jeong, HJ. 2020. Spatio-temporal distributions of the newly described mixotrophic dinoflagellate Yihiella yeosuensis (Suessiaceae) in Korean coastal waters and its grazing impact on prey populations. Algae. 35:45–59. Jang, SH., Jeong, HJ., Lee, MJ., Kim, JH. & You, JH. 2019.
Gyrodinium jinhaense n. sp., a new heterotrophic unarmored dinoflagellate from the coastal waters of Korea. J Eukaryot Microbiol. 66:821–835. Jeong, HJ. 1994. Predation by the heterotrophic dinoflagellate Protoperidinium cf. divergens on copepod eggs and early naupliar stages. Mar Ecol Prog Ser. 114:203–208. Jeong, HJ. 1999. The ecological roles of heterotrophic dinoflagellates in marine planktonic community. J Eukaryot Microbiol. 46:390–396. Jeong, HJ., Kang, HC., Lim, AS., Jang, SH., Lee, K., Lee, SY., Ok, JH., You, JH., Kim, JH., Lee, KH., Park, SA., Eom, SH., Yoo, YD. & Kim, KY. 2021. Feeding diverse prey as an excellent strategy of mixotrophic dinoflagellates for global dominance. Sci Adv. 7:eabe4214 pp. Jeong, HJ., Kim, TH., Yoo, YD., Yoon, EY., Kim, JS., Seong, KA., Kim, KY. & Park, JY. 2011. Grazing impact of heterotrophic dinoflagellates and ciliates on common red-tide euglenophyte Eutreptiella gymnastica in Masan Bay, Korea. Harmful Algae. 10:576–588. Jeong, HJ. & Latz, MI. 1994. Growth and grazing rates of the heterotrophic dinoflagellate Protoperidinium spp. on red tide dinoflagellates. Mar Ecol Prog Ser. 106:173–185. Jeong, HJ., Lim, AS., Franks, PJS., Lee, KH., Kim, JH., Kang, NS., Lee, MJ., Jang, SH., Lee, SY., Yoon, EY., Park, JY., Yoo, YD., Seong, KA., Kwon, JE. & Jang, TY. 2015. A hierarchy of conceptual models of red-tide generation: nutrition, behavior, and biological interactions. Harmful Algae. 47:97–115. Jeong, HJ., Lim, AS., Yoo, YD., Lee, MJ., Lee, KH., Jang, TY. & Lee, K. 2014. Feeding by heterotrophic dinoflagellates and ciliates on the free-living dinoflagellate Symbiodinium sp. (Clade E). J Eukaryot Microbiol. 61:27–41. Jeong, HJ., Seong, KA., Yoo, YD., Kim, TH., Kang, NS., Kim, S., Park, JY., Kim, JS., Kim, GH. & Song, JY. 2008. Feeding and grazing impact by small marine heterotrophic dinoflagellates on heterotrophic bacteria. J Eukaryot Microbiol. 55:271–288. Jeong, HJ., Yoo, YD., Kim, JS., Seong, KA., Kang, NS. & Kim, TH. 2010. Growth, feeding and ecological roles of the mixotrophic and heterotrophic dinoflagellates in marine planktonic food webs. Ocean Sci J. 45:65–91. Johnson, MD., Rome, M. & Stoecker, DK. 2003. Microzooplankton grazing on Prorocentrum minimum and Karlodinium micrum in Chesapeake Bay. Limnol Oceanogr. 48:238–248. Kang, HC., Jeong, HJ., Jang, SH. & Lee, KH. 2019. Feeding by common heterotrophic protists on the phototrophic dinoflagellate Biecheleriopsis adriatica (Suessiaceae) compared to that of other suessioid dinoflagellates. Algae. 34:127–140. Kang, HC., Jeong, HJ., Kim, SJ., You, JH. & Ok, JH. 2018. Differential feeding by common heterotrophic protists on 12 different Alexandrium species. Harmful Algae. 78:106–117. Kang, HC., Jeong, HJ., Park, SA., Eom, SH., Ok, JH., You, JH., Jang, SH. & Lee, SY. 2020. Feeding by the newly described heterotrophic dinoflagellate Gyrodinium jinhaense: comparison with G. dominans and G moestrupii
. Mar Biol. 167:156 pp.
Kibbe, WA. 2007. OligoCalc: an online oligonucleotide properties calculator. Nucleic Acids Res. 35:W43–W46. Kilias, E., Wolf, C., Nöthig, E-M., Peeken, I. & Metfies, K. 2013. Protist distribution in the Western Fram Strait in summer 2010 based on 454-pyrosequencing of 18S rDNA. J Phycol. 49:996–1010. Kim, JS. & Jeong, HJ. 2004. Feeding by the heterotrophic dinoflagellates Gyrodinium dominans and G. spirale on the red-tide dinoflagellate Prorocentrum minimum
. Mar Ecol Prog Ser. 280:85–94. Kiφrboe, T. & Titelman, J. 1998. Feeding, prey selection and prey encounter mechanisms in the heterotrophic dinoflagellate Noctiluca scintillans
. J Plankton Res. 20:1615–1636. Larsen, J. 1996. Unarmoured dinoflagellates from Australian waters II. Genus Gyrodinium (Gymnodiniales, Dinophyceae). Phycologia. 35:342–349. Lee, KH., Jeong, HJ., Yoon, EY., Jang, SH., Kim, HS. & Yih, W. 2014. Feeding by common heterotrophic dinoflagellates and a ciliate on the red-tide ciliate Mesodinium rubrum
. Algae. 29:153–163. Lee, SY., Jeong, HJ., Kwon, JE., You, JH., Kim, SJ., Ok, JH., Kang, HC. & Park, JY. 2019. First report of the photosynthetic dinoflagellate Heterocapsa minima in the Pacific Ocean: morphological and genetic characterizations and the nationwide distribution in Korea. Algae. 34:7–21. Lee, SY., Jeong, HJ., Ok, JH., Kang, HC. & You, JH. 2020. Spatial-temporal distributions of the newly described mixotrophic dinoflagellate Gymnodinium smaydae in Korean coastal waters. Algae. 35:225–236. Lee, SY., Jeong, HJ., Seong, KA., Lim, AS., Kim, JH., Lee, KH., Lee, MJ. & Jang, SH. 2017. Improved real-time PCR method for quantification of the abundance of all known ribotypes of the ichthyotoxic dinoflagellate Cochlodinium polykrikoides by comparing 4 different preparation methods. Harmful Algae. 63:23–31. Lee, SY., Jeong, HJ., You, JH. & Kim, SJ. 2018. Morphological and genetic characterization and the nationwide distribution of the phototrophic dinoflagellate Scrippsiella lachrymosa in the Korean waters. Algae. 33:21–35. Lim, AS., Jeong, HJ., Seong, KA., Lee, MJ., Kang, NS., Jang, SH., Lee, KH., Park, JY., Jang, TY. & Yoo, YD. 2017. Ichthyotoxic Cochlodinium polykrikoides red tides offshore in the South Sea, Korea in 2014: II. Heterotrophic protists and their grazing impacts on red-tide organisms. Algae. 32:199–222. Litaker, RW., Vandersea, MW., Kibler, SR., Reece, KS., Stokes, NA., Steidinger, KA., Millie, DF., Bendis, BJ., Pigg, RJ. & Tester, PA. 2003. Identification of Pfiesteria piscicida (dinophyceae) and Pfiesteria-like organisms using internal transcribed spacer-specific PCR assays. J Phycol. 39:754–761. Menden-Deuer, S., Lessard, EJ., Satterberg, J. & Grünbaum, D. 2005. Growth rates and starvation survival of three species of the pallium-feeding, thecate dinoflagellate genus Protoperidinium
. Aquat Microb Ecol. 41:145–152. Nakamura, Y., Suzuki, SY. & Hiromi, J. 1995a. Growth and grazing of a naked heterotrophic dinoflagellate, Gyrodinium dominans
. Aquat Microb Ecol. 9:157–164. Nakamura, Y., Suzuki, S-Y. & Hiromi, J. 1995.
b. Population dynamics of heterotrophic dinoflagellates during a Gymnodinium mikimotoi red tide in the Seto Inland Sea. Mar Ecol Prog Ser. 125:269–277. Peterson, DH. & Festa, JF. 1984. Numerical simulation of phytoplankton productivity in partially mixed estuaries. Estuar Coast Shelf Sci. 19:563–589. Potvin, E., Hwang, YJ., Yoo, YD., Kim, JS. & Jeong, HJ. 2013. Feeding by heterotrophic protists and copepods on the photosynthetic dinoflagellate Azadinium cf. poporum from western Korean waters. Aquat Microb Ecol. 68:143–158. Sherr, EB. & Sherr, BF. 2007. Heterotrophic dinoflagellates: a significant component of microzooplankton biomass and major grazers of diatoms in the sea. Mar Ecol Prog Ser. 352:187–197. Smayda, TJ. 1997. Harmful algal blooms: their ecophysiology and general relevance to phytoplankton blooms in the sea. Limnol Oceanogr. 42:1137–1153. Smith, KF., Rhodes, L., Harwood, DT., Adamson, J., Moisan, C., Munday, R. & Tillmann, U. 2016. Detection of Azadinium poporum in New Zealand: the use of molecular tools to assist with species isolations. J Appl Phycol. 28:1125–1132. Stern, RF., Horak, A., Andrew, RL., Coffroth, M-A., Andersen, RA., Küpper, FC., Jameson, I., Hoppenrath, M., Véron, B., Kasai, F., Brand, J., James, ER. & Keeling, PJ. 2010. Environmental barcoding reveals massive dinoflagellate diversity in marine environments. PLoS ONE. 5:e13991 pp. Stoecker, DK., Hansen, PJ., Caron, DA. & Mitra, A. 2017. Mixotrophy in the marine plankton. Annu Rev Mar Sci. 9:311–335. Strom, SL. & Buskey, EJ. 1993. Feeding, growth, and behavior of the thecate heterotrophic dinoflagellate Oblea rotunda
. Limnol Oceanogr. 38:965–977. Takano, Y. & Horiguchi, T. 2004. Surface ultrastructure and molecular phylogenetics of four unarmored heterotrophic dinoflagellates, including the type species of the genus Gyrodinium (Dinophyceae). Phycol Res. 52:107–116. Tamura, K., Dudley, J., Nei, M. & Kumar, S. 2007. MEGA4: molecular evolutionary genetics analysis (MEGA) software version 4.0. Mol Biol Evol. 24:1596–1599. Taylor, FJR., Hoppenrath, M. & Saldarriaga, JF. 2008. Dinoflagellate diversity and distribution. Biodivers Conserv. 17:407–418. Traboni, C., Calbet, A. & Saiz, E. 2020. Effects of prey trophic mode on the gross-growth efficiency of marine copepods: the case of mixoplankton. Sci Rep. 10:12259 pp. Xu, J., Hansen, PJ., Nielsen, LT., Krock, B., Tillmann, U. & Kiørboe, T. 2017. Distinctly different behavioral responses of a copepod, Temora longicornis, to different strains of toxic dinoflagellates, Alexandrium spp. Harmful Algae. 62:1–9. Yoo, YD., Jeong, HJ., Kim, JS., Kim, TH., Kim, JH., Seong, KA., Lee, SH., Kang, NS., Park, JW., Park, J., Yoon, EY. & Yih, WH. 2013a. Red tides in Masan Bay, Korea in 2004–2005: II. Daily variations in the abundance of heterotrophic protists and their grazing impact on red-tide organisms. Harmful Algae. 30(Suppl 1):S89–S101. Yoo, YD., Yoon, EY., Jeong, HJ., Lee, KH., Hwang, YJ., Seong, KA., Kim, JS. & Park, JY. 2013.
b. The newly described heterotrophic dinoflagellate Gyrodinium moestrupii, an effective protistan grazer of toxic dinoflagellates. J Eukaryot Microbiol. 60:13–24. Yoon, EY., Kang, NS. & Jeong, HJ. 2012.
Gyrodinium moestrupii n. sp., a new planktonic heterotrophic dinoflagellate from the coastal waters of western Korea: morphology and ribosomal DNA gene sequence. J Eukaryot Microbiol. 59:571–586. You, JH., Jeong, HJ., Kang, HC., Ok, JH., Park, SA. & Lim, AS. 2020. Feeding by common heterotrophic protist predators on seven Prorocentrum species. Algae. 35:61–78.
|
|