Kang, Jeong, Ok, You, Jang, Lee, Lee, Park, and Rho: Spatial and seasonal distributions of the phototrophic dinoflagellate Biecheleriopsis adriatica (Suessiaceae) in Korea: quantification using qPCR
ABSTRACT
The phototrophic dinoflagellate Biecheleriopsis adriatica is a small suessioid species characterized by a fragile thin wall. Although the morphology of this dinoflagellate is well established, there is currently little information available on its distribution and the environmental factors that influence this distribution. Thus, to investigate the spatial and seasonal distributions of the vegetative cells of B. adriatica in Korean waters, surface water samples were collected on a seasonal basis from 28 stations in the East, West, and South Sea of Korea and Jeju Island from April 2015 to October 2018, and abundances of the vegetative cells of B. adriatica were quantified using quantitative real-time polymerase chain reactions, for which we developed the species-specific primer and probe set. Simultaneously, major environmental parameters, including temperature, salinity, nutrient concentrations, and dissolved oxygen concentrations were measured. The vegetative cells of B. adriatica were detected at 20 of the 28 sampling stations: 19 stations in summer and 6 in autumn, although from no stations in either spring or winter. The ranges of water temperature and salinity at sites where this species was detected were 17.7–26.4°C and 9.9–34.3, respectively, whereas those of nitrate and phosphate concentrations were not detectable-96.2 and 0.18–2.66 μM, respectively. Thus, the sites at which this species is found are characterized by a narrow range of temperature, but wide ranges of salinity and concentrations of nitrate and phosphate. The highest abundance of the vegetative cells of B. adriatica was 41.7 cells mL−1, which was recorded in Jinhae Bay in July 2018. In Jinhae Bay, the abundance of vegetative cells was significantly positively correlated with the concentration of nitrate, but was negatively correlated with salinity. On the basis of these findings, it appears that the abundance of B. adriatica vegetative cells shows strong seasonality, and in Jinhae Bay, could be affected by the concentrations of nitrate.
Key words: abundance; molecular method; nationwide distribution; protist; Suessiaceae
INTRODUCTION
Phototrophic dinoflagellates are a major component of marine ecosystem ( Hallegraeff 1993, Taylor et al. 2008, Selina and Levchenko 2011, Jeong et al. 2013, 2017). These algae play diverse roles in marine ecosystems as primary producers, prey for a wide range of predators, predators on numerous different prey items, parasites, and symbiotic partners ( Park et al. 2004, Tillmann 2004, Jeong et al. 2010, Hansen 2011, Johnson 2015, Stoecker et al. 2017, Kang et al. 2018, LaJeunesse et al. 2018). Many phototrophic dinoflagellate species form red tides or harmful algal blooms that can often cause extensive mortalities among marine organisms, and subsequently considerable losses in aquaculture industries ( Shumway 1990, Landsberg 2002, Park et al. 2013, Adolf et al. 2015, Menden-Deuer and Montalbano 2015). The abundance of a dinoflagellate species at a given time and in a specific area is a critical parameter in understanding its bloom dynamics (e.g., Jeong et al. 2015). Moreover, some dinoflagellate species can become invasive, thereby disrupting the balance of marine ecosystems ( Hallegraeff 1998, Olenina et al. 2010, Telesh et al. 2016). Therefore, the presence of invasive dinoflagellates in a particular country is of critical concern to scientists and those employed in the aquacultural industries of that country. In many marine ecosystems, there are typically large spatial and temporal variations in the abundance of dinoflagellate species ( Warner et al. 2006, Litaker et al. 2010, Jeong et al. 2013, 2017). The relatively rapid growth of dinoflagellates through binary division ( Smayda 1997, Jeong et al. 2010, 2015), together with their high sensitivity to certain environmental parameters, such as water temperature, light intensity, and nutrient concentrations ( Heaney and Eppley 1981, Singh and Singh 2015, Lee et al. 2017a, Jeong et al. 2018b), and intense competition with other microalgal groups, may cause considerable variations in their abundance ( Smayda and Reynolds 2003, Kremp et al. 2008, Jeong et al. 2018a). Thus, to understand ecological roles of a dinoflagellate in marine ecosystems, its spatial and temporal distributions and environmental factors affecting the distributions should be explored. Species of dinoflagellate in the order Suessiales are characterized by a cell surface covered with numerous thin plates ( Lindberg et al. 2005, Siano et al. 2009, Jang et al. 2015). Owing to small cell sizes and fragile thin walls, there is a difficulty in quantifying the abundance, and thus the distribution, of many suessioid dinoflagellate species, and accordingly, to date there has been limited information available regarding the abundance and distribution of these species. In 2009, Biecheleriopsis adriatica was reported as a new genus and species in the order Suessiales ( Moestrup et al. 2009). This species has a type E eyespot and a single elongated apical vesicle, which are key characteristics of the family Suessiaceae; however, unlike other genera belonging to this family, the cells of B. adriatica possess a nuclear fibrous connective and a distinct tongue-like process in the left ventral corner of the asymmetric hyposome ( Moestrup et al. 2009, Takahashi et al. 2014, Jang et al. 2015, Luo et al. 2015, Kang and Wang 2018). Vegetative cells of this species have been found in the Adriatic Sea and in the coastal waters of Korea, China, Japan, the Philippines, Singapore, and Palau Island ( Moestrup et al. 2009, Takahashi et al. 2014, Jang et al. 2015, Luo et al. 2015, Benico et al. 2019), whereas resting cysts have been found in sediments of the China and Black seas ( Luo et al. 2015, Dzhembekova et al. 2018, Kang and Wang 2018). To date, there has been only a single study reporting the abundance of the vegetative cells of B. adriatica ( Benico et al. 2019) in blooms dominated by the phototrophic dinoflagellate Takayama sp. at Bolinao in the Philippines, which was quantified using a microscopic enumeration method. However, to the best of our knowledge, there have as yet been no studies that have examined the seasonal or regional distribution of B. adriatica. To understand its ecological roles in marine ecosystems, the spatial and/or seasonal distribution of the vegetative cells of B. adriatica should be explored. Given that the cells of B. adriatica are small (equivalent spherical diameter = approximately 10 μm) and have fragile thin plates ( Jang et al. 2015), and that there are some suessioid dinoflagellates with morphologies similar to that of B. adriatica, even when observed using scanning electron microscope (e.g., Kang et al. 2011), quantification of the abundance of the vegetative cells of B. adriatica should ideally be performed using one of the molecular techniques that are often used for small dinoflagellate species ( Bowers et al. 2000, Godhe et al. 2008, Correa et al. 2009, Lee et al. 2019). In the present study, to explore spatial and seasonal distributions of the vegetative cells of B. adriatica in Korea, its abundance was quantified in the surface waters of 28 stations, located in the East, West, and South Sea of Korea and Jeju Island in four seasons from April 2015 to October 2018, using quantitative real-time polymerase chain reactions (qPCR) and newly designed B. adriatica-specific primer-probe set. Simultaneously, major environmental parameters such as temperature, salinity, nutrient concentrations, and dissolved oxygen (DO) concentrations were determined. The results of the present study provide a basis on understanding the spatial and temporal distributions of B. adriatica and critical environmental factors affecting the distributions.
MATERIALS AND METHODS
Preparation of experimental organisms
Cells of B. adriatica were isolated from plankton samples collected from the surface waters off the coast of Tongyoung, Korea, using plankton samplers in August 2006, when the water temperature and salinity were 28.0°C and 31.0, respectively ( Jang et al. 2015). The collected samples were screened using a 154-μm Nitex mesh. A clonal culture of B. adriatica BATY06 was established using two consecutive single-cell isolations ( Jang et al. 2015). When the concentration of B. adriatica had increased sufficiently, the volume was increased to 32, 270, and 500 mL in PC bottles containing fresh f/2 medium. The bottles were filled to capacity with fresh f/2 seawater medium, capped, and placed on a shelf at 20°C, illuminated with an irradiance of 20 μmol photons m −2 s −1 provided by cool white fluorescent lights, under a 14 : 10 h light : dark cycle. Only cultures in the exponential growth phase were used for observations. To determine whether the vegetative cells of B. adriatica can be distinguished from those of other dinoflagellates having similar morphologies in fixed samples, the morphological characters of vegetative cells of B. adriatica BATY06 were compared with those of the vegetative cells of Ansanella granifera AGSW10 ( Jeong et al. 2014a), Biecheleria cincta BCSW0906 ( Kang et al. 2011), Pelagodinium bei RCC3655 (obtained from the Roscoff Culture Collection, France) and Paragymnodinium shiwhaense PSSH0605 ( Kang et al. 2010), Effrenium voratum SvFL1 ( Jeong et al. 2014b), Gymnodinium smaydae GSSW10 ( Kang et al. 2014), and Yihiella yeosuensis YY1405 ( Jang et al. 2017), and the American strain of Pfiesteria piscicida CCMP2091 (obtained from the National Center for Marine Algae and Microbiota, USA) using both living cells and those fixed with fixatives. For microscopic observation of living vegetative cells, a 10-mL aliquot was taken from a 250-mL bottle containing each dinoflagellate species and transferred to a 30-mL flask. One-hundred-microliter aliquots were then taken from the flask and transferred to a confocal dish (35-mm in external diameter with a hole diameter of 13 mm; SPL, Pocheon, Korea). Cells of each species in the confocal dish were photographed using a digital camera (Zeiss AxioCam HRc5; Carl Zeiss Ltd., Göttingen, Germany) attached to an inverted microscope at a magnification of ×400. Similarly, for microscopic observation of fixed vegetative cells, a 10-mL aliquot was taken from a 250-mL bottle containing each dinoflagellate species and transferred to a 30-mL flask. Five-milliliter aliquots were then taken from the flask, transferred to a 20-mL scintillation vial, and fixed with 5% Lugol’s solution (final concentration). Furthermore, 1-mL aliquots were taken from flasks, transferred to a 20-mL scintillation vial, and fixed with 1% formalin (final concentration). One-hundred-microliter aliquots were taken from the vial and transferred to a confocal dish. Cells of each species in the confocal dish were photographed using the digital camera attached to the inverted microscope at a magnification of ×400.
Hydrographical properties
Using a clean bucket, surface water samples were collected from 28 stations located in the East, West, and South Sea of Korea, and Jeju Island, Korea, in April, July, and October of 2015; January, March, June–July, September–October, and December of 2016; March, July, and October of 2017; and January–February, March, July, and October of 2018 ( Fig. 1). The temperature, salinity, and DO for each sample were measured using an YSI Professional Plus instrument (YSI Inc., Yellow Springs, OH, USA). The water samples for nutrient concentration analysis were gently filtered through GF/F filters (Whatman Inc., Floreham Park, NJ, USA) and stored at −20°C until the concentrations of nitrate plus nitrite (NO3 + NO2, hereafter NO3), phosphate (PO4), and silicate (SiO2) were measured using a nutrient auto-analyzer system (QuAAtro; Seal Analytical Gmbh, Norderstedt, Germany).
Design of TaqMan probe and primer set
Using the internal transcribed spacer (ITS) rDNA sequences of strain of B. adriatica and related dinoflagellates available from GenBank, the ITS sequence of B. adriatica BATY06 obtained from polymerase chain reaction amplification was aligned using the program MEGA v.4. To determine the unique sequences and to develop a B. adriatica–specific qPCR assay, manual searches of the alignments were conducted. The sequences for the primer-probe sets were selected from conserved regions within the B. adriatica strains, but enabled discrimination from other dinoflagellates. For determinations of optimal melting temperature and secondary structure, the primer and probe sequences of B. adriatica were analyzed using Primer 3 (Whitehead Institute, Cambridge, MA, USA; Howard Hughes Medical Institute, Chevi Chase, MD, USA) and Oligo Calc: Oligonucleotide Properties Calculator ( Kibbe 2007). Subsequently, the primers and probe were synthesized by BioResearch (Petaluma, CA, USA). The probe was dual-labeled at the 5′ and 3′ ends with the fluorescent dyes FAM and BHQ1 (BioResearch), respectively ( Table 1). A species specificity test for the primers and probe for B. adriatica BATY06 was conducted using nine dinoflagellate species ( Appendix 1).
Quantification of the abundance of Biecheleriopsis adriatica in Korean waters
For qPCR, 50–300 mL of the water samples collected from each station at each time interval were filtered through a 25-mm GF/C filter (Whatman Inc.). The filter was loosely rolled and placed into a 1.5-mL tube and frozen at −20°C until transfer to the laboratory. For each sample, DNA was extracted from the cells on filters using an AccuPrep Genomic DNA Extraction Kit (Bioneer, Daejeon, Korea), according to the manufacturer’s instructions.
Standard curve preparation and qPCR amplification
Nucleic acids were extracted from 10 to 15 mL of a dense culture of B. adriatica BATY06 as described above. For standard curve construction, DNA was extracted from a dense culture of B. adriatica BATY06, containing approximately 1,000,000 cells in the final elution volume of 100 μL, as described above. To prepare seven different DNA concentrations, targeting 100, 10, 1, 0.1, 0.01, 0.001, and 0.0001% of the originally extracted DNA, the extracted DNA was serially diluted by adding predetermined volumes of sterile deionized distilled water (DDW; Bioneer) to the 1.5-mL tubes. Subsequently, the DNA samples were stored at −20°C in a freezer and qPCR amplification was conducted within 24 h. The qPCR assays used for determination of the standard curve were performed using the following steps, as described by Lee et al. (2017b). Reaction mixtures for each sample were prepared from 1 μL of DNA template, 0.2 μM of primers (forward and reverse), and 0.15 μM of probe (final concentrations), and 5 μL of qPCRBIO Probe Separate-ROX (Genepole, Gwangmyeong, Korea), made up to a final volume of 10 μL with DDW. qPCR analyses were performed using a Rotor-Gene Q thermal cycler (Qiagen, Hilden, Germany) under the following thermal cycling conditions: 3 min at 95°C, followed by 45 cycles of 10 s at 95°C, and 40 s at 58°C. To determine the concentration of B. adriatica in field samples, the aforementioned qPCR assay conditions were used. To ensure the accuracy of results, the DNA extracted from each sample was amplified four times. A sample containing DDW as the template was used as a negative control, whereas one used for standard curve construction was used as positive and standard control.
RESULTS
Comparison of the morphology of nine different dinoflagellates
Morphologically, the living vegetative cells of B. adriatica were very similar to those of A. granifera ( Fig. 2A & B). Furthermore, the overall morphology of B. adriatica cells fixed with 5% Lugol’s solution was similar to that of A. granifera, B. cincta, E. voratum, G. smaydae, Paragymnodinium shiwhaense, Pelagodinium bei, Pfiesteria piscicida, and Y. yeosuensis ( Fig. 2). Similarly, on the basis of morphology, it was not possible to distinguish B. adriatica cells fixed with 1% formalin from the formalin-fixed cells of other species examined in this study ( Fig. 2).
Hydrography in the study areas during the study period
From April 2015 to October 2018, the water temperatures at the 28 sampling stations ranged from 0.2 to 28.0°C ( Fig. 3A, Appendix 2). The minimum water temperature was recorded in January 2018 at Dangjin and Seocheon (West Sea), whereas the maximum water temperature was recorded at Dangjin in July 2017. Furthermore, the salinity at the 28 stations from April 2015 to October 2018 ranged from 0.1 to 35.6 ( Fig. 3A, Appendix 2). The minimum salinity was recorded in March 2016 at Kwangyang (South Sea), and the maximum was recorded at Mageompo (West Sea) in October 2016. The concentration of NO 3 at the 28 stations from April 2015 to October 2018 ranged from not detectable (ND) to 149.0 μM ( Fig. 3B, Appendix 3), with the maximum concentration being recorded at Seogwipo (Jeju Island) in July 2015. The concentration of PO 4 at the 28 stations from April 2015 to October 2018 ranged from ND to 6.31 μM ( Fig. 3B, Appendix 3), with the maximum concentration being recorded in Jinhae Bay (South Sea) in July 2015. The concentration of SiO 2 at the 28 stations from April 2015 to October 2018 ranged from ND to 453.4 μM ( Fig. 3C, Appendix 3), with the maximum concentration being recorded at Seogwipo (Jeju Island) in July 2015. The concentration of DO at the 28 stations from April 2015 to October 2018 ranged from 0.2 to 14.8 mg L −1 ( Fig. 3C), with maximum concentration being recorded at Ansan (West Sea) in March 2018.
Spatial distribution of Biecheleriopsis adriatica in Korean waters
The qPCR analyses indicated the presence of B. adriatica in the waters of 20 of the 28 sampling stations ( Figs 4 & 5). The coastal waters in which the species was not detected are as follows: Seocheon (West Sea), Kwangyang and Goheung (South Sea), Pohang and Uljin (East Sea), Seogwipo, Wimi, and Seongsan (Jeju Island). The highest abundance of B. adriatica (41.7 cells mL −1) was recorded in Jinhae Bay (South Sea) in July 2018. The second highest abundance (25.3 cells mL −1) was also recorded in Jinhae Bay in July 2017, whereas the third highest abundance, (18.3 cells mL −1) was recorded at Kunsan (West Sea) in July 2016 ( Tables 2 & 3).
Seasonal distribution of Biecheleriopsis adriatica in Korean waters
We found that cells of B. adriatica were only present in samples collected in the summer and autumn months ( Figs 4 & 5). Moreover, the number of stations at which B. adriatica cells were detected in the summer (19) was considerably greater than that at which they were detected in the autumn (6) ( Figs 4 & 5). Furthermore, the maximum abundance of B. adriatica recorded in the summer (41.7 cells mL −1) was considerably higher than that recorded in the autumn (9.8 cells mL −1). Thus, these results provide evidence of a strong seasonality in the occurrence and abundance of B. adriatica in Korean waters. The summer water temperatures and salinities at stations where B. adriatica was detected ranged from 17.7 to 26.4°C and 9.9 to 33.8, respectively, whereas those in the autumn ranged from 19.4 to 23.5°C and 24.6 to 34.3, respectively ( Fig. 6A & B, Appendix 2). Furthermore, the concentrations of NO 3, PO 4, SiO 2, and DO in the summer at the stations where B. adriatica was detected ranged from ND to 96.2, 0.18 to 2.66, and 2.4 to 448.4 μM, and 3.7 to 10.8 mg L −1, respectively, whereas those in the autumn ranged from 4.4 to 25.0, 0.34 to 1.78, and 38.4 to 132.7 μM, and 6.1 to 7.9 mg L −1, respectively ( Fig. 6C–F, Appendix 3). The water temperatures and salinities coinciding with the highest, second highest, and third highest recorded abundances of B. adriatica in Jinhae Bay, and at Kunsan ranged from 23.2 to 23.8°C and 22.8 to 29.3, respectively, whereas the concentrations of NO 3, PO 4, SiO 2, and DO ranged from 8.7 to 28.8, 0.44 to 1.65, and 36.4 to 70.3 μM, and 5.4 to 10.8 mg L −1, respectively ( Fig. 6).
Correlations between Biecheleriopsis adriatica abundance and environmental parameters
Analyses of all data obtained from all stations and all sampling times (n = 395) revealed that abundances of the vegetative cells of B. adriatica were significantly correlated with water temperature and salinity (p < 0.01 or 0.05), but was not significantly correlated with NO 3, PO 4, SiO 2, or DO concentrations (p > 0.1) ( Table 4). However, we did find that water temperature was significantly positively correlated with NO 3, PO 4, and SiO 2 concentrations, but negatively with salinity and DO concentration (p < 0.01) ( Table 4). Moreover, salinity was significantly positively correlated with DO, but negatively correlated with NO 3, PO 4, and SiO 2 concentrations (p < 0.01) ( Table 4), whereas NO 3 concentration was significantly positively correlated with PO 4 and SiO 2 concentrations (p < 0.01) ( Table 4). In Jinhae Bay, in which we recorded the maximum abundance of the vegetative cells of B. adriatica, vegetative cell abundance was significantly positively correlated with the concentration of NO 3 (p < 0.01), but negatively correlated with salinity (p < 0.01) ( Table 5, Fig. 7). Furthermore, water temperature was significantly positively correlated with NO 3 concentration (p < 0.05), but negatively correlated with salinity (p < 0.05) ( Table 5). Moreover, salinity was significantly negatively with NO 3 and SiO 2 concentrations (p < 0.01), but showed no significant correlation with PO 4 concentration (p > 0.1) ( Table 5). Similarly, NO 3 concentration was significantly positively correlated with SiO 2 concentration (p < 0.01), but showed no significant correlation with PO 4 concentration (p > 0.1) ( Table 5).
DISCUSSION
The results of the present study indicate that, morphologically, the vegetative cells of B. adriatica cannot be distinguished from those of several other dinoflagellates when the cells are fixed with either 5% Lugol’s solution or 1% formalin and then observed under a light microscope. Accordingly, difficulties are likely to be encountered in attempting to quantify the abundance of B. adriatica in fixed field samples. In contrast, qPCR would appear to be an acceptable method for quantifying B. adriatica abundance.
We found that the vegetative cells of B. adriatica have a wide spatial distribution in Korean waters. Previously, the vegetative cells of B. adriatica have been collected from the waters off Tongyoung, Pohang, and Shiwha, which are located between the latitude of 35°04′ N and 37°33′ N ( Jang et al. 2015). In the present study, we found that the latitudinal range within which vegetative cells of B. adriatica were collected extends from 33°17′ N to 38°12′ N. Thus, the findings of this study widen the latitudinal range in which vegetative cells of B. adriatica are known to occur in Korean waters. Furthermore, prior to the present study, the global distribution of the vegetative cells of B. adriatica was reported to lie within the latitudes 01°13′ N to 38°45′ N ( Table 6). Thus, our observations do not extend the currently established latitudinal range of the vegetative cells of this dinoflagellate. We also discovered that the occurrence of vegetative B. adriatica cells shows a strong seasonality. Vegetative cells were recorded from July and October when water temperatures were between 17.7 and 26.4°C. Previously, in Korea, vegetative cells of B. adriatica have been recorded in August and September when recorded water temperatures were between 23.0 and 28.0°C ( Jang et al. 2015). Thus, on the basis of the findings of the present study, we have established that in Korean waters, the temperatures at which vegetative cells of B. adriatica occur ranges from 17.7 to 28.0°C. Given that, prior to the present study, the occurrence of vegetative B. adriatica cells in oceans worldwide has been reported in waters with temperatures ranging from 21.0 to 32.0°C ( Table 6), the findings of the present study extends this range to 17.7–32.0°C. In terms of salinity, we found that the vegetative cells of B. adriatica occur within the range 9.9–34.3. At the lowest recorded salinity, the abundance of the vegetative cells of B. adriatica was 3.6 cells mL −1. Thus, this abundance is not a negligible value. Previously, vegetative cells of B. adriatica were found in Korean waters with salinities ranging from 24.0 to 31.0 ( Jang et al. 2015). Thus, on the basis of the findings of the present study, we have established an extended range of salinities (9.9–34.3) in which the vegetative cells of B. adriatica are present in Korean waters. Furthermore, given that the previously reported range for oceans worldwide was 24.0–35.0, our findings also extend the global range of salinities in which the vegetative cells of B. adriatica have been reported to 9.9–35.0 ( Table 6). Prior to the present study, there had been no studies reporting data on the concentrations of NO3, PO4, and SiO2 in waters inhabited by the vegetative cells of B. adriatica. Thus, relationships between the concentrations of NO3, PO4, and SiO2 and the presence of these vegetative cells are reported here for the first time. We found that the vegetative cells of B. adriatica occur in Korean water with wide-ranging concentrations of NO3, PO4, and SiO2 (ND-96.2, 0.18–2.66, and 2.4–448.4 μM, respectively). However, when all the data were analyzed, it was apparent that vegetative cell abundance showed no significant correlation with the concentrations NO3, PO4, SiO2, and DO, and thus it seems unlikely that these parameters have any pronounced effect on the presence and abundance of the vegetative cells of B. adriatica in Korean waters. Having said this, however, in the waters Jinhae Bay, we did find at least some evidence of a relationship between vegetative cell abundance and nutrient concentrations. It was in these waters in which we recorded the maximum abundance of B. adriatica vegetative cells, and the concentrations of NO3, PO4, and SiO2 were 28.8, 0.44, and 70.3 μM, respectively. Given that the ranges of NO3, PO4, and SiO2 concentrations recorded in Jinhae Bay during the study period were 1.1–28.8, 0.22–6.31, and 4.5–84.6 μM, respectively, it can be seen that the vegetative cells of B. adriatica were most abundant when the concentration of NO3 was at its highest level. Indeed, abundances of the vegetative cells of B. adriatica were found to be significantly positively correlated with the concentration of NO3 in the waters of Jinhae Bay. Thus, the concentration of NO3 may be a critical factor affecting the abundance of the vegetative cells of B. adriatica in this bay.
Interestingly, however, the maximum abundance of the vegetative cells of B. adriatica in Korean waters recorded in the present study (41.7 cells mL −1) is somewhat lower than that recorded at Bolinao in the Philippines (299–305 cells mL −1) ( Benico et al. 2019), whereas the mean concentration of NO 3 at Bolinao, during the period from 1995 to 2005 was only 0.21–2.17 μM ( San Diego-McGlone et al. 2008), which is considerably lower than the concentration recorded in Jinhae Bay during the present study period. Thus, it is conceivable that the ecophysiology of B. adriatica in Jinhae Bay differs from that of B. adriatica in the waters off Bolinao. However, further studies will be necessary to verify this conjecture.
ACKNOWLEDGEMENTS
We thank An Suk Lim, Sang Ah Park, and Se Hyun Kim for technical support. This research was supported by the Useful Dinoflagellate program of Korea Institute of Marine Science and Technology Promotion (KIMST) funded by the Ministry of Oceans and Fisheries (MOF) and Development of the methods for controlling and managing marine ecological disturbance causing and harmful organisms (MEDHO) funded by the Ministry of Oceans and Fisheries, the National Research Foundation (NRF) funded by the Ministry of Science and ICT (NRF-2015M1A5A1041806; NRF-2017R1E1A1A01074419) award to HJJ.
Fig. 1
Map showing the locations of sampling stations in the study area in Korea. The circles indicate the sampling stations. West Sea: AS, Ansan; DAJ, Dangjin; TA, Taean; MGP, Mageompo; SCN, Seocheon; KS, Kunsan; BA, Buan; MP, Mokpo. South Sea: BS, Busan; DDP, Dadaepo; JH, Jinhae; MS, Masan; TY, Tongyoung; YS, Yeosu; KY, Kwangyang; GH, Goheung; JAH, Jangheung. East Sea: SC, Sokcho; JMJ, Jumunjin; DH, Donghae; UJ, Uljin; PH, Pohang; US, Ulsan. Jeju: AW, Aewol; SGP, Seogwipo; WM, Wimi; SS, Seongsan; GN, Gimnyeong. 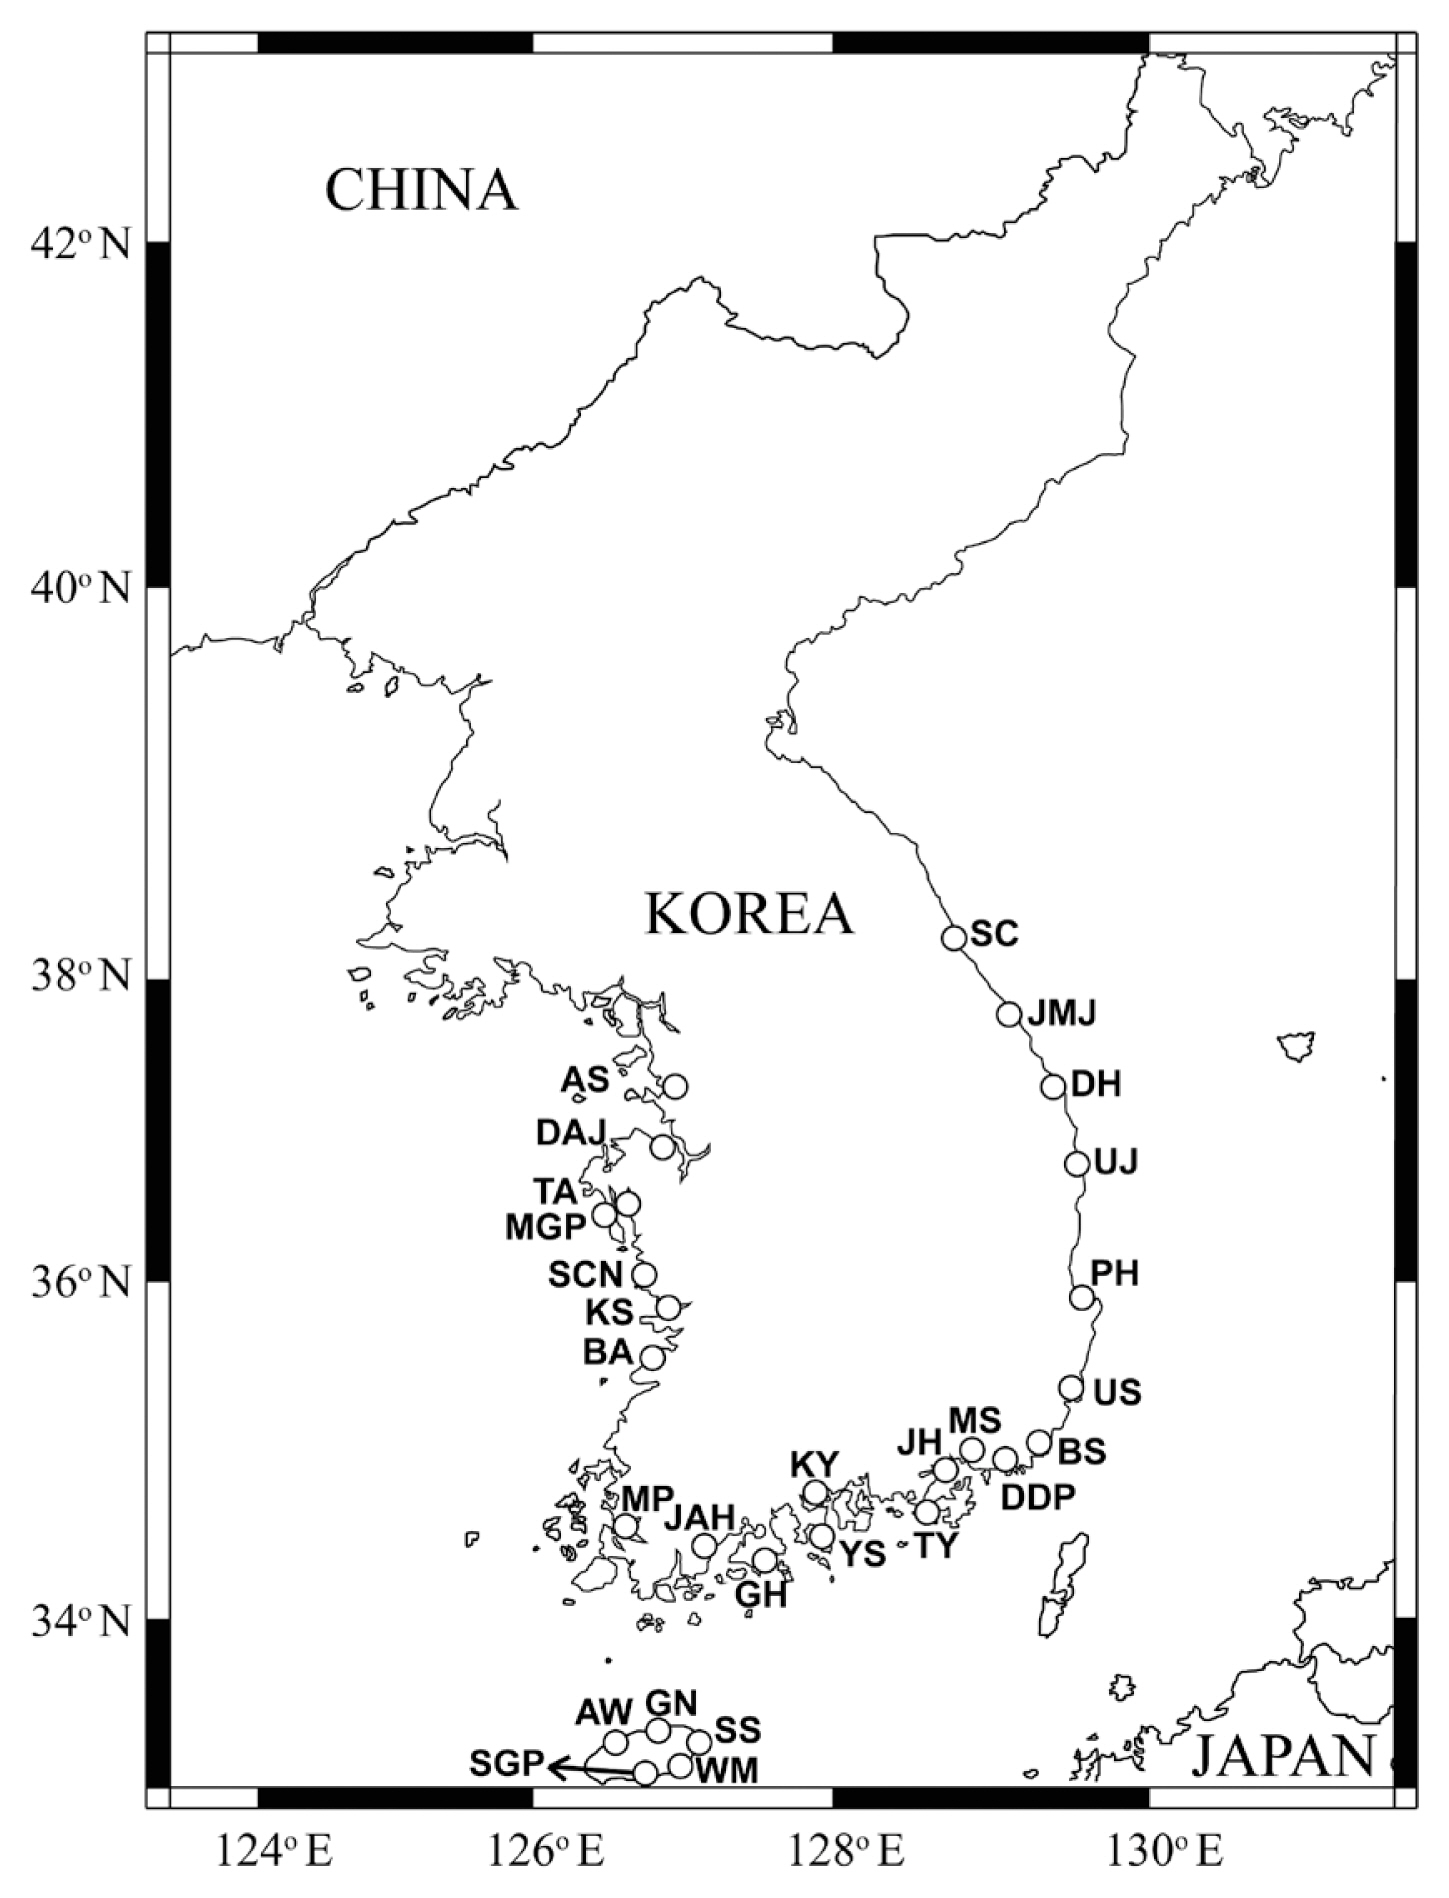
Fig. 2
Comparison of the morphology of vegetative cells of Biecheleriopsis adriatica and other dinoflagellate species observed under a light microscope. Living cells (left column). Cells fixed with 5% Lugol’s solution (central column). Cells fixed with 1% formalin solution (right column). (A) B. adriatica BATY06 (Ba). (B) Ansanella granifera AGSW10 (Ag). (C) Biecheleria cincta BCSW0906 (Bc). (D) Effrenium voratum SvFL1 (Ev). (E) Gymnodinium smaydae GSSW10 (Gs). (F) Paragymnodinium shiwhaense PSSH0605 (Ps). (G) Pelagodinium bei RCC3655 (Pb). (H) Pfiesteria piscicida CCMP2091 (Pp). (I) Yihiella yeosuensis YY1405 (Yy). Scale bars represent: A–I, 5 μm. 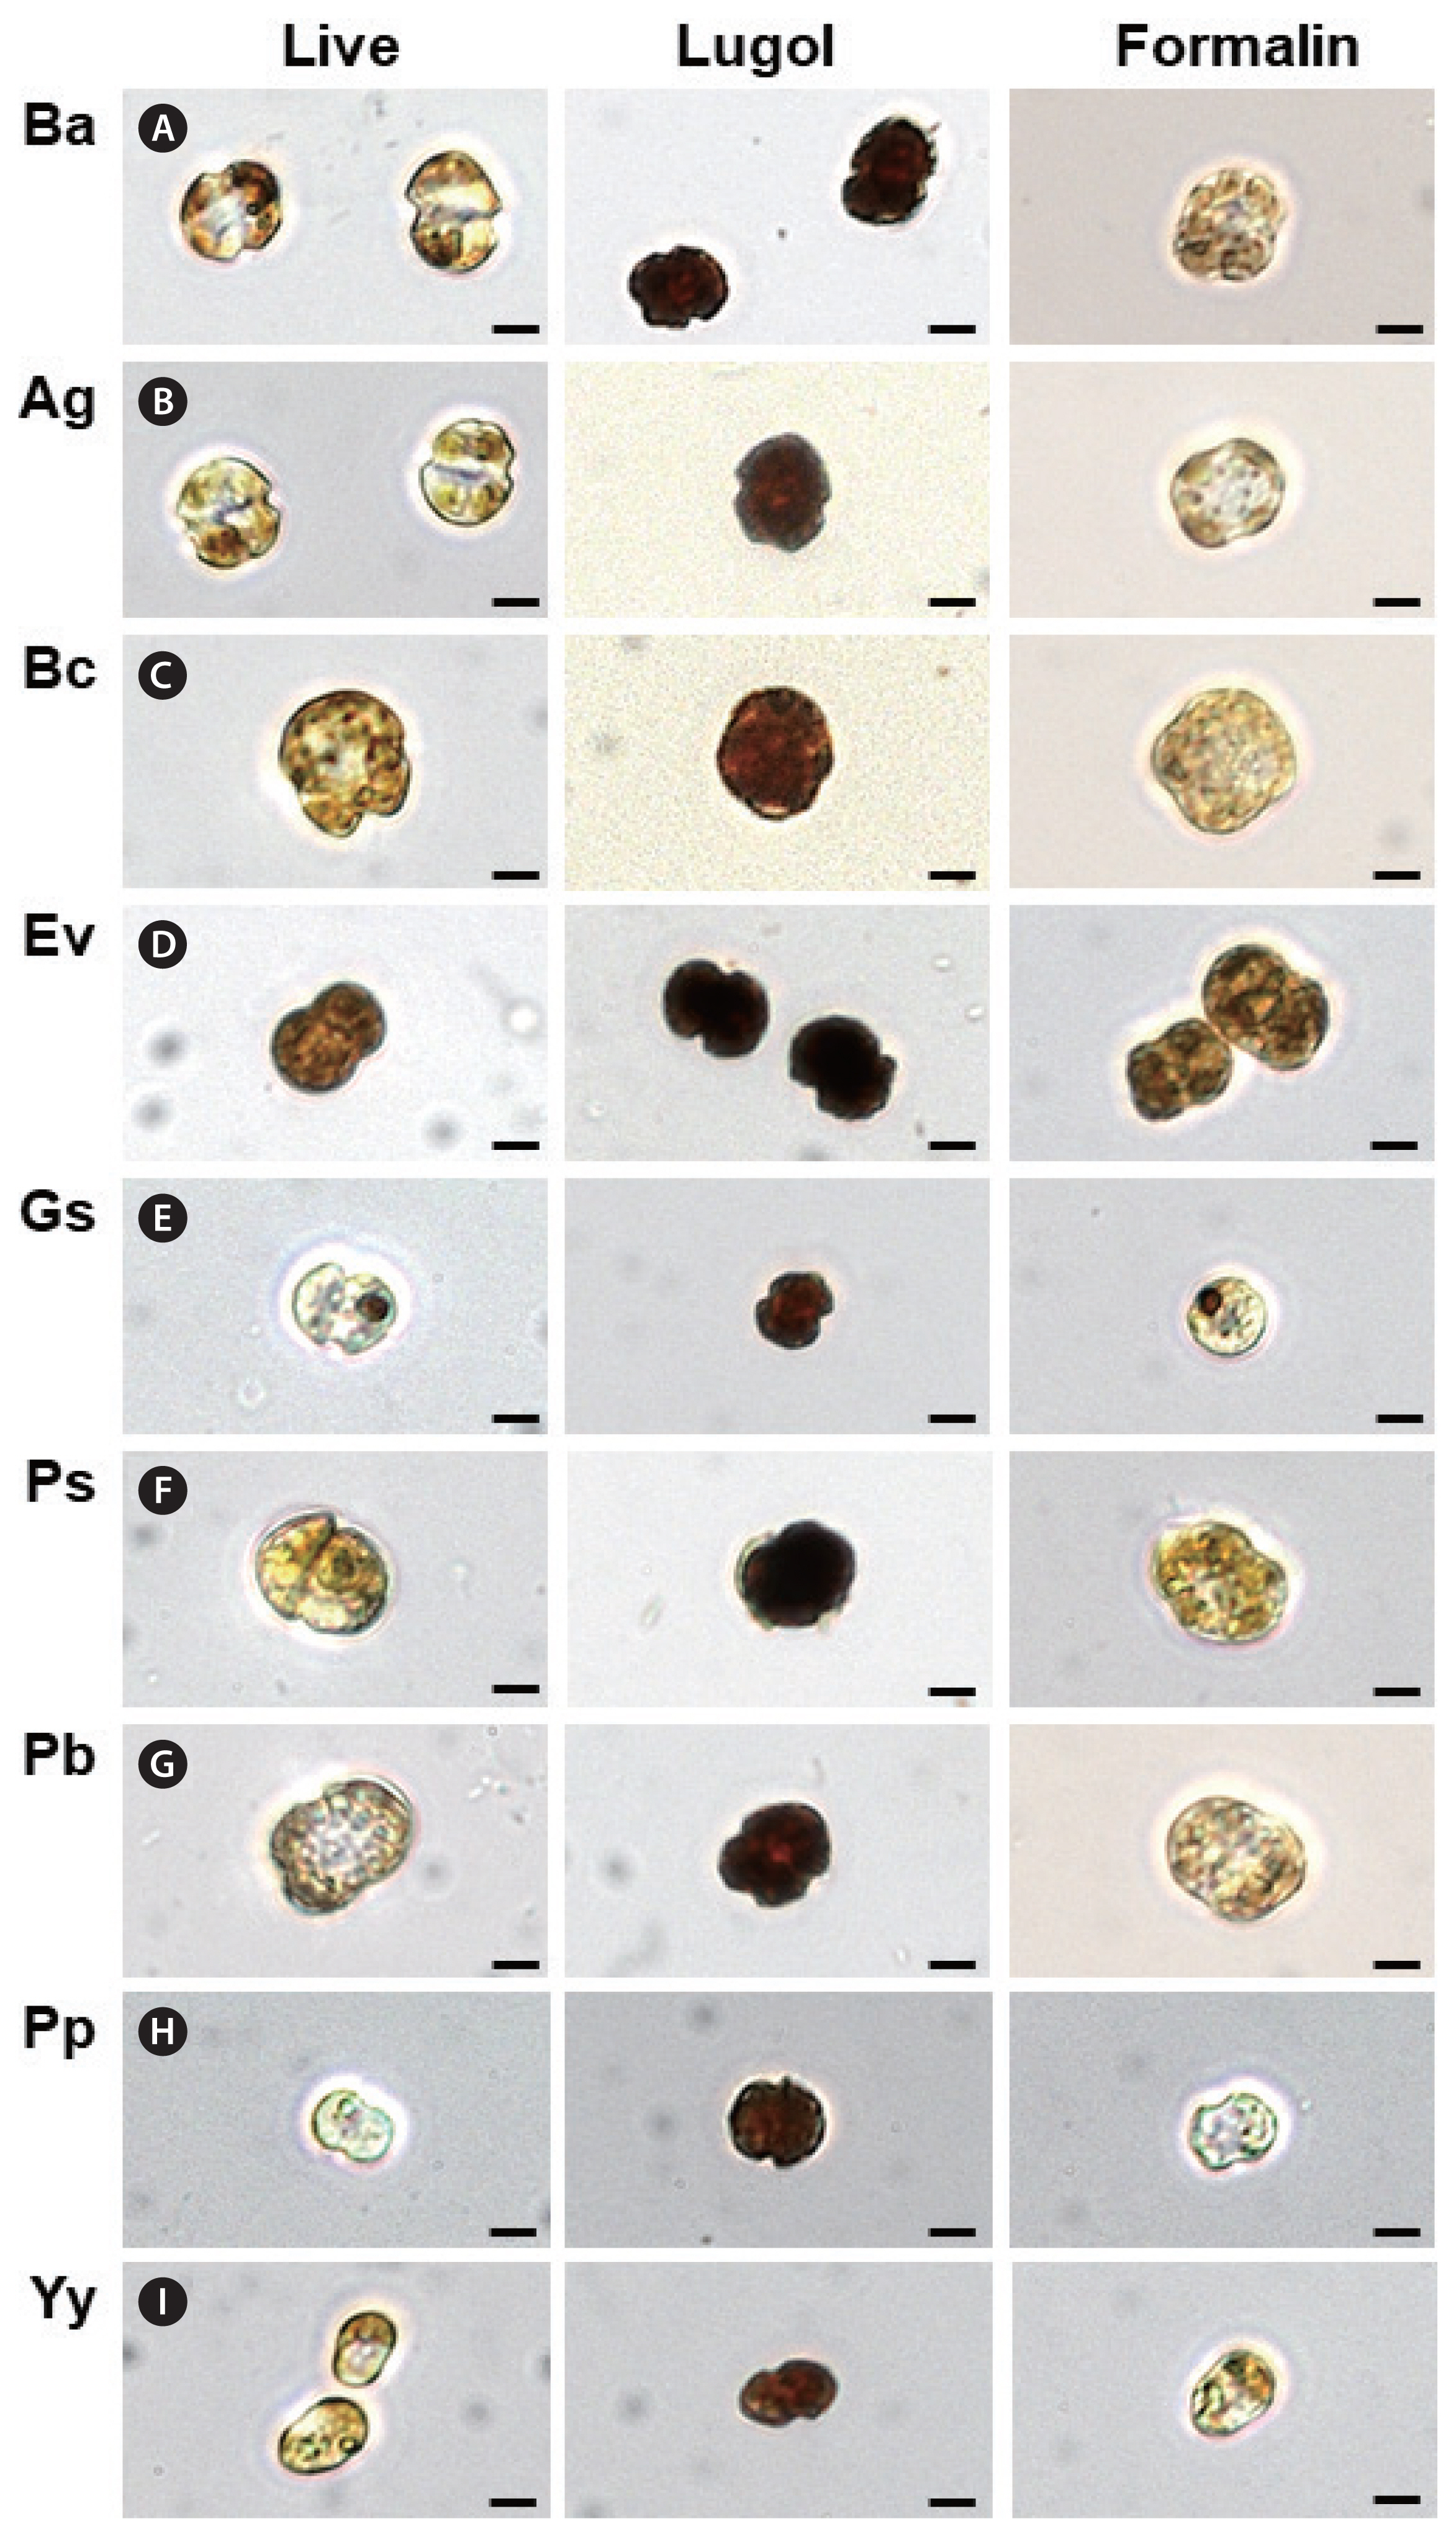
Fig. 3
Environmental parameters recorded at the sampling stations from April 2015 to October 2018. (A) Water temperature ( T, °C) versus salinity (S). (B) Nitrate + nitrite (NO3, μM) versus phosphate (PO4, μM). (C) Silicate (SiO2, μM) versus dissolved oxygen (DO, mg L−1). 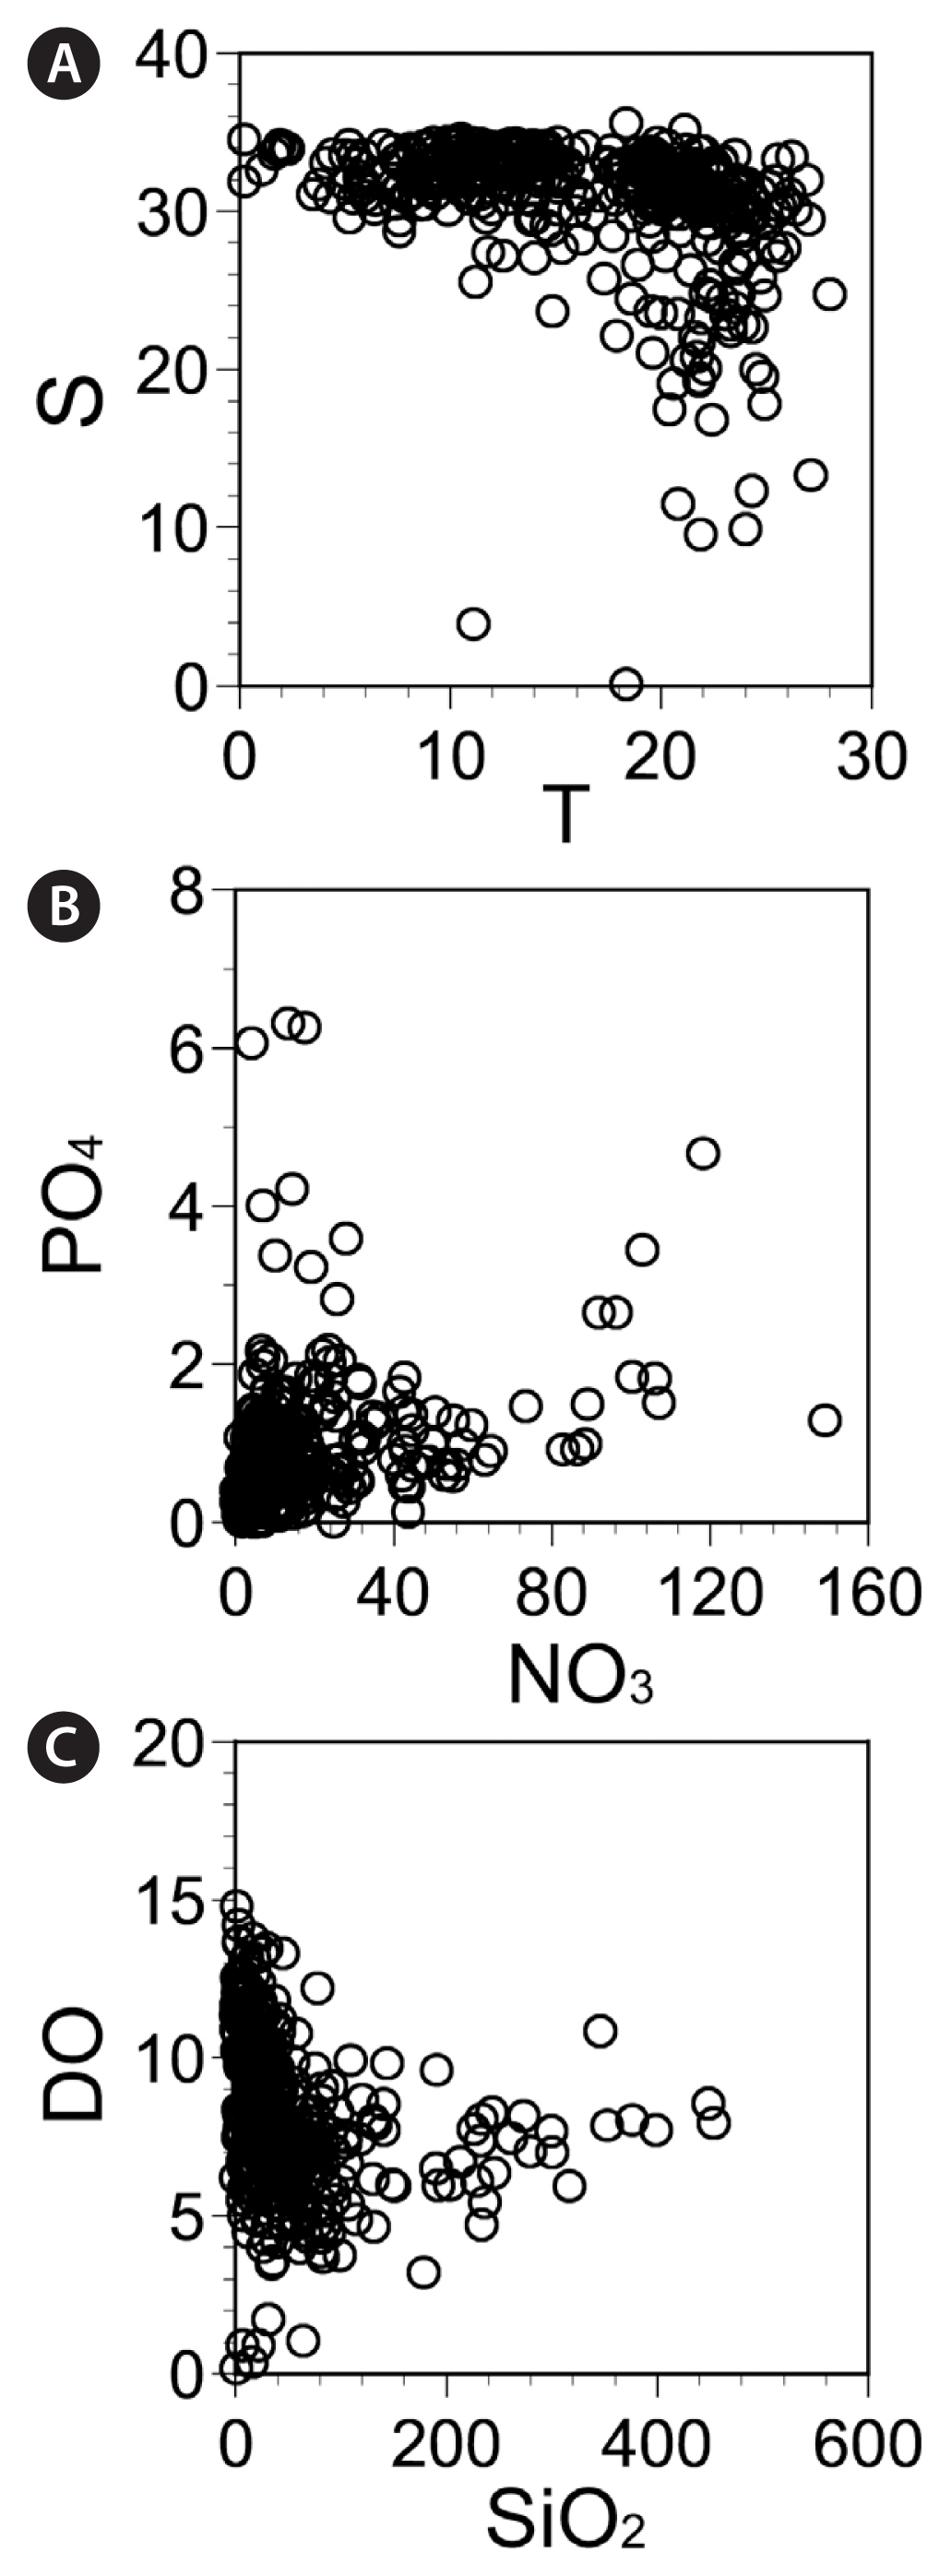
Fig. 4
Map of the sampling stations indicating the presence and absence of vegetative cells of Biecheleriopsis adriatica in the spring (March or April) (A) and summer (June or July) (B) during the period from 2015 to 2018. The red closed circles indicate the stations at which B. adriatica cells were detected, whereas the black open circles indicate the stations at which B. adriatica cells were not detected. 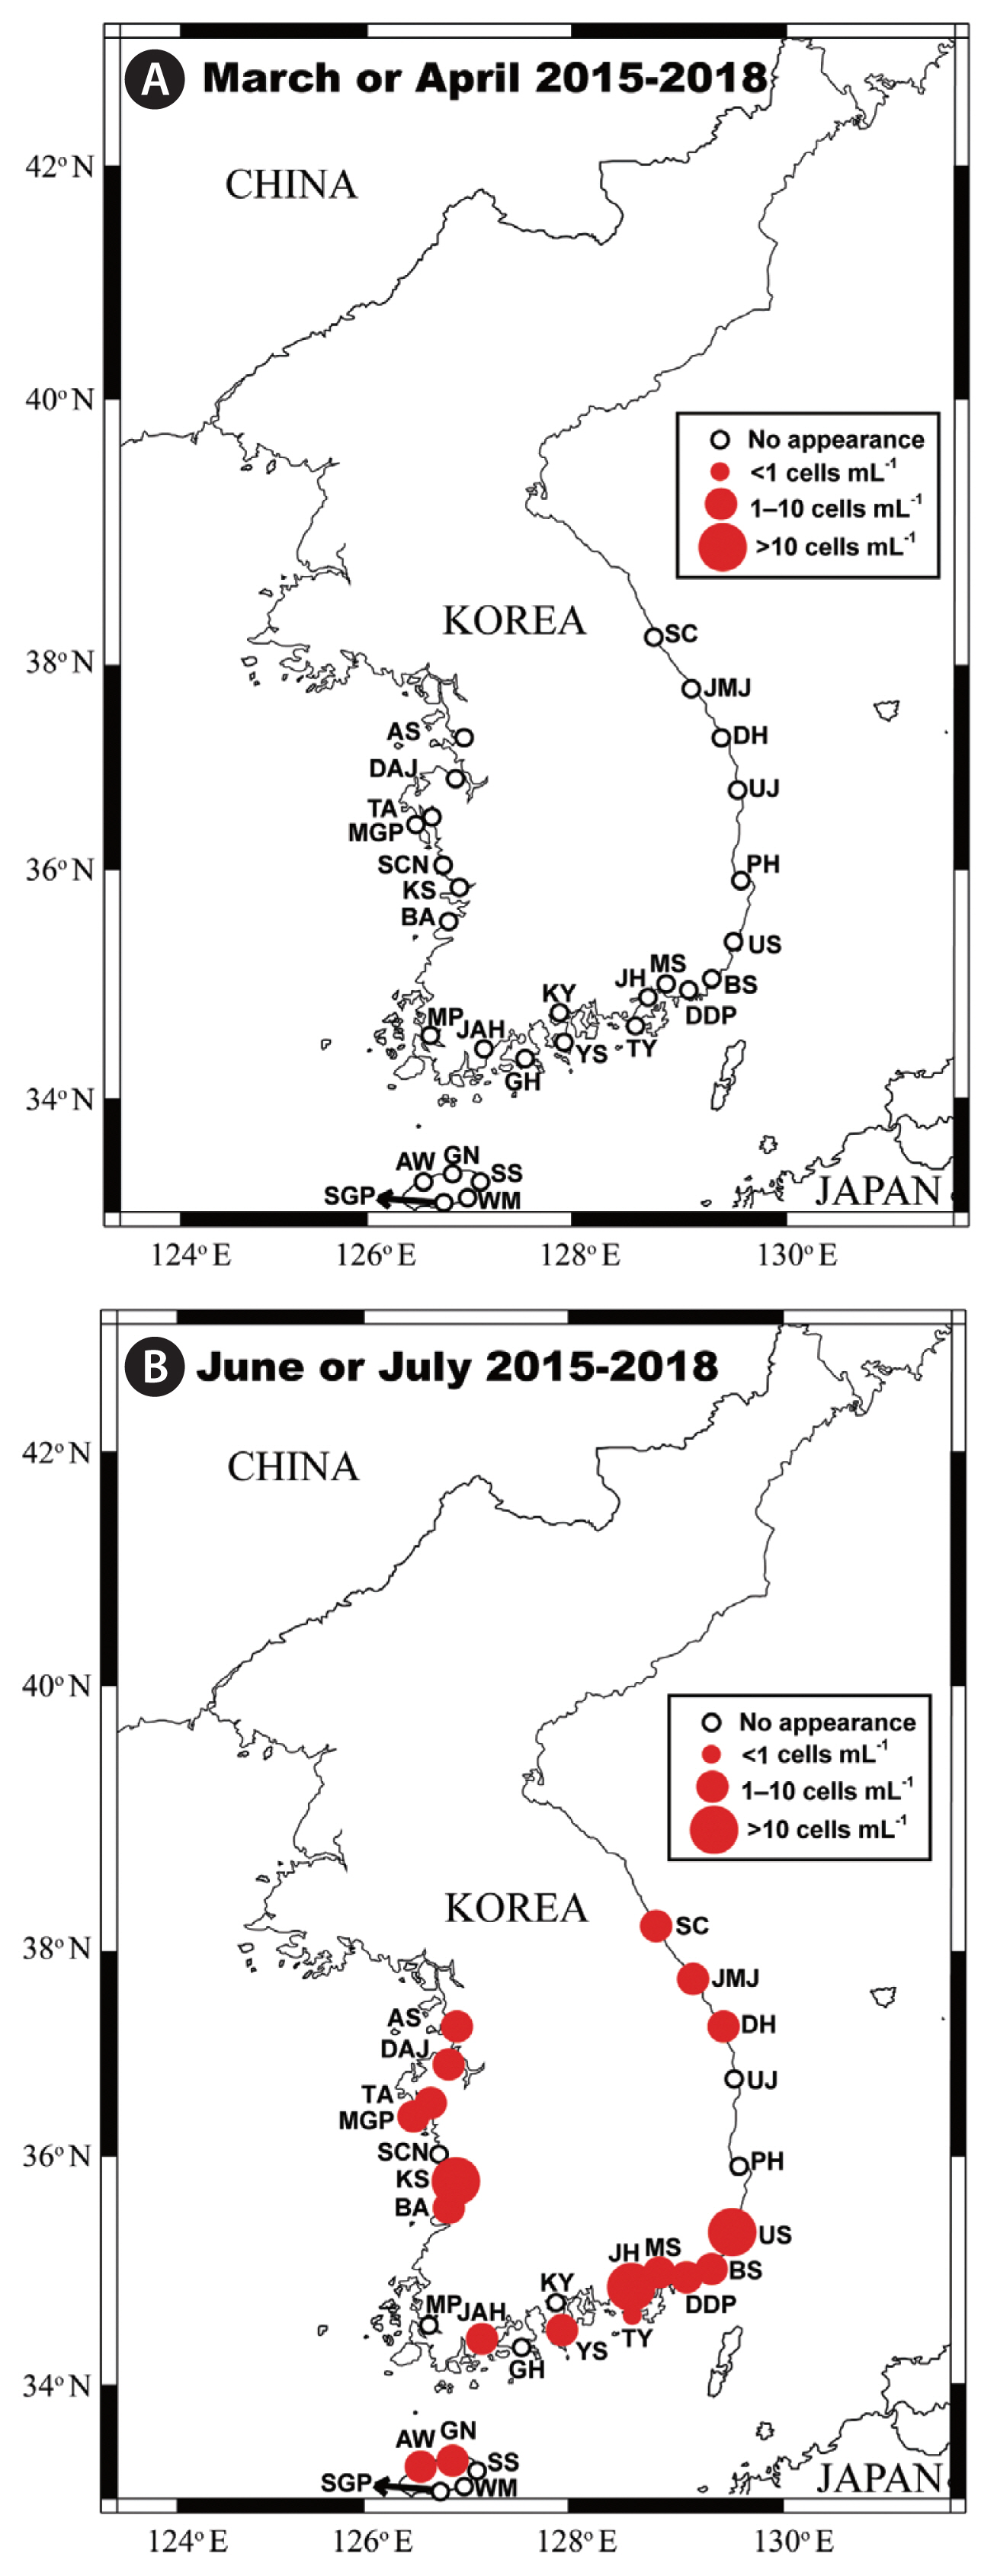
Fig. 5
Map of the sampling stations indicating the presence and absence of vegetative cells of Biecheleriopsis adriatica in the autumn (September or October) (A) and winter (December or January) (B) during the period from 2015 to 2018. The red closed circles indicate the stations at which B. adriatica cells were detected, whereas the black open circles indicate the stations at which B. adriatica cells were not detected. 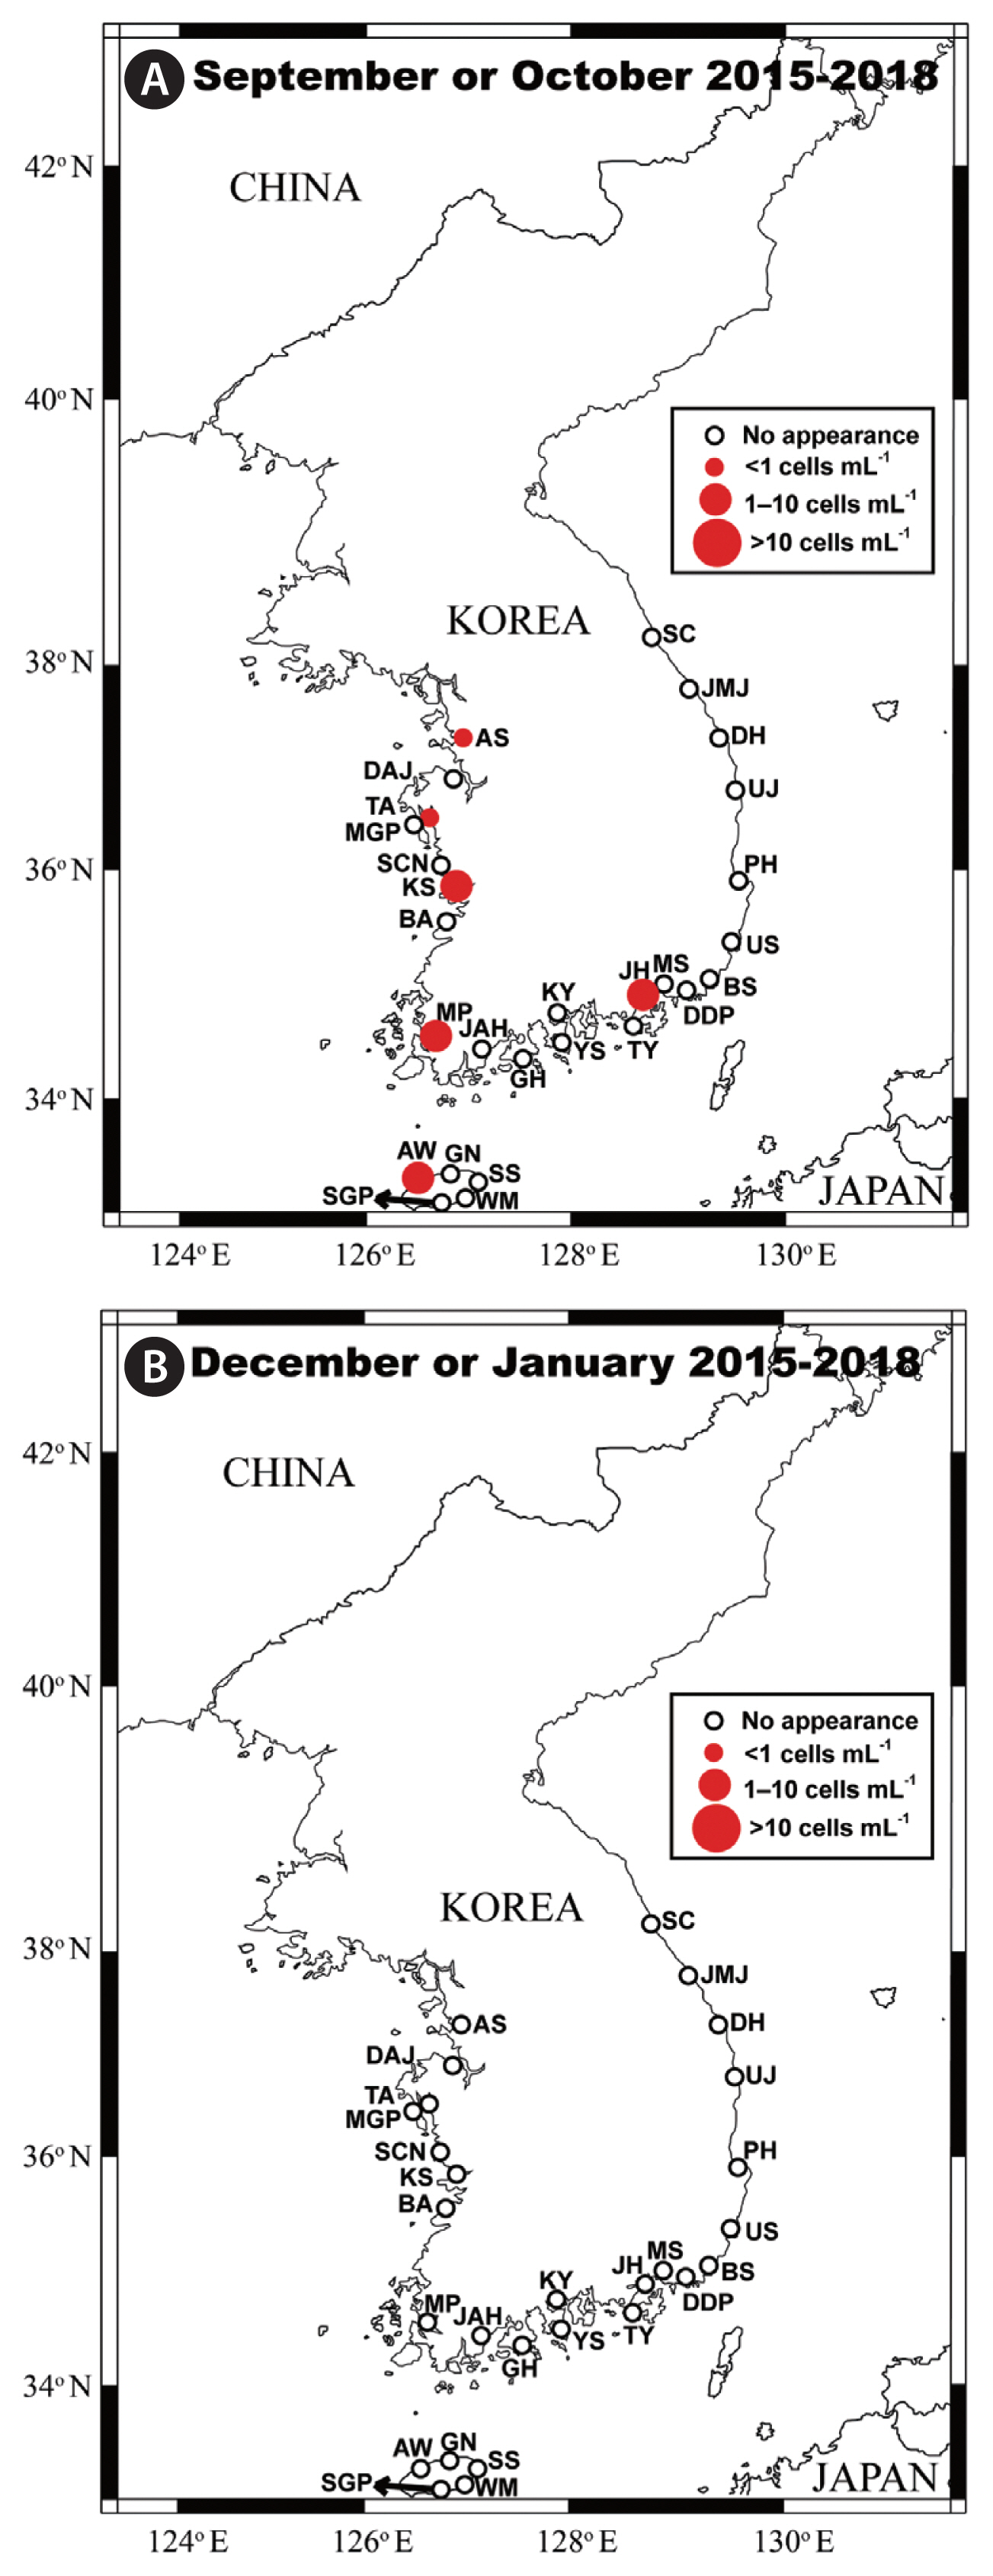
Fig. 6
Abundance (Ab, cells mL−1) of the vegetative cells of Biecheleriopsis adriatica as a function of each of the recorded environmental parameters at all sampling stations from April 2015 to October 2018 (n = 395). (A) Water temperature (T, °C). (B) Salinity (S). (C) Nitrate + nitrite (NO3, μM). (D) Phosphate (PO4, μM). (E) Silicate (SiO2, μM). (F) Dissolved oxygen (DO, mg L−1). The red closed circles indicate the stations at which B. adriatica cells were detected, whereas the black open circles indicate the stations at which B. adriatica cells were not detected. 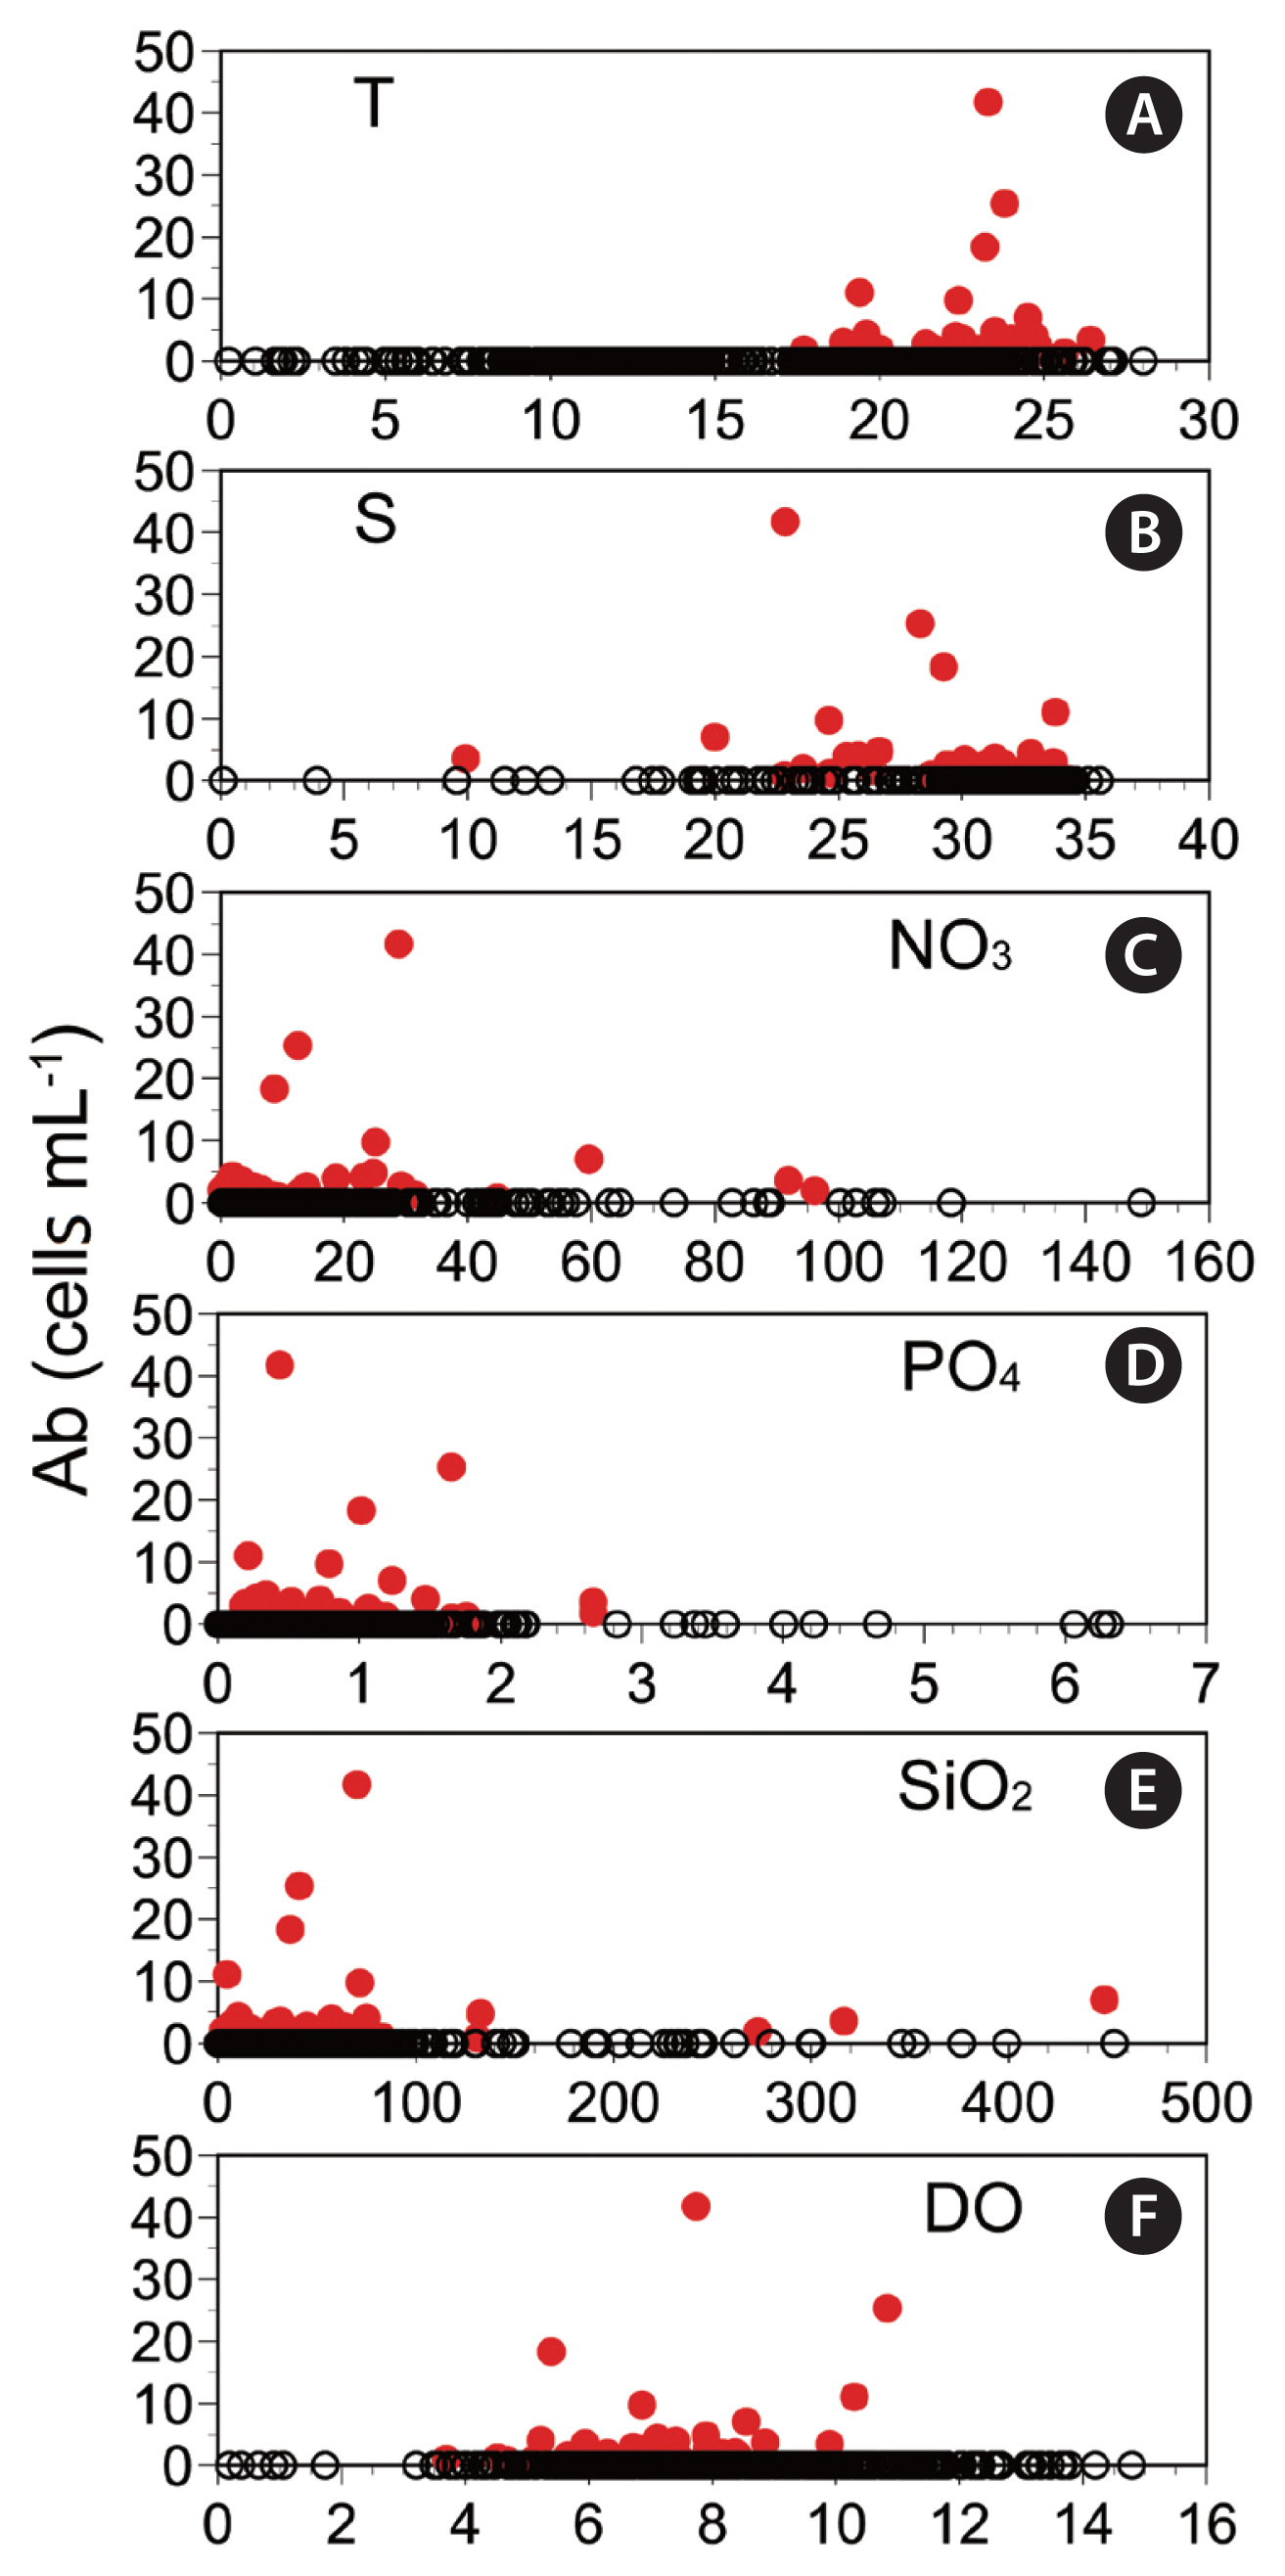
Fig. 7
Abundance (Ab, cells mL−1) of the vegetative cells of Biecheleriopsis adriatica as a function of each of the recorded environmental parameters in Jinhae Bay from April 2015 to October 2018 (n = 14). (A) Water temperature (T, °C). (B) Salinity (S). (C) Nitrate + nitrite (NO3, μM). (D) Phosphate (PO4, μM). (E) Silicate (SiO2, μM). (F) Dissolved oxygen (DO, mg L−1). The p-value in (B) and (C) is <0.01, whereas that in (A), (D), (E), and (F) is >0.1. The equations of the curves are as follows: Ab (cells mL−1) = −3.29 (S) + 106, and r2 = 0.697 for (B) and Ab (cells mL−1) = 1.07 (NO3) − 4.83, and r2 = 0.531 for (C). 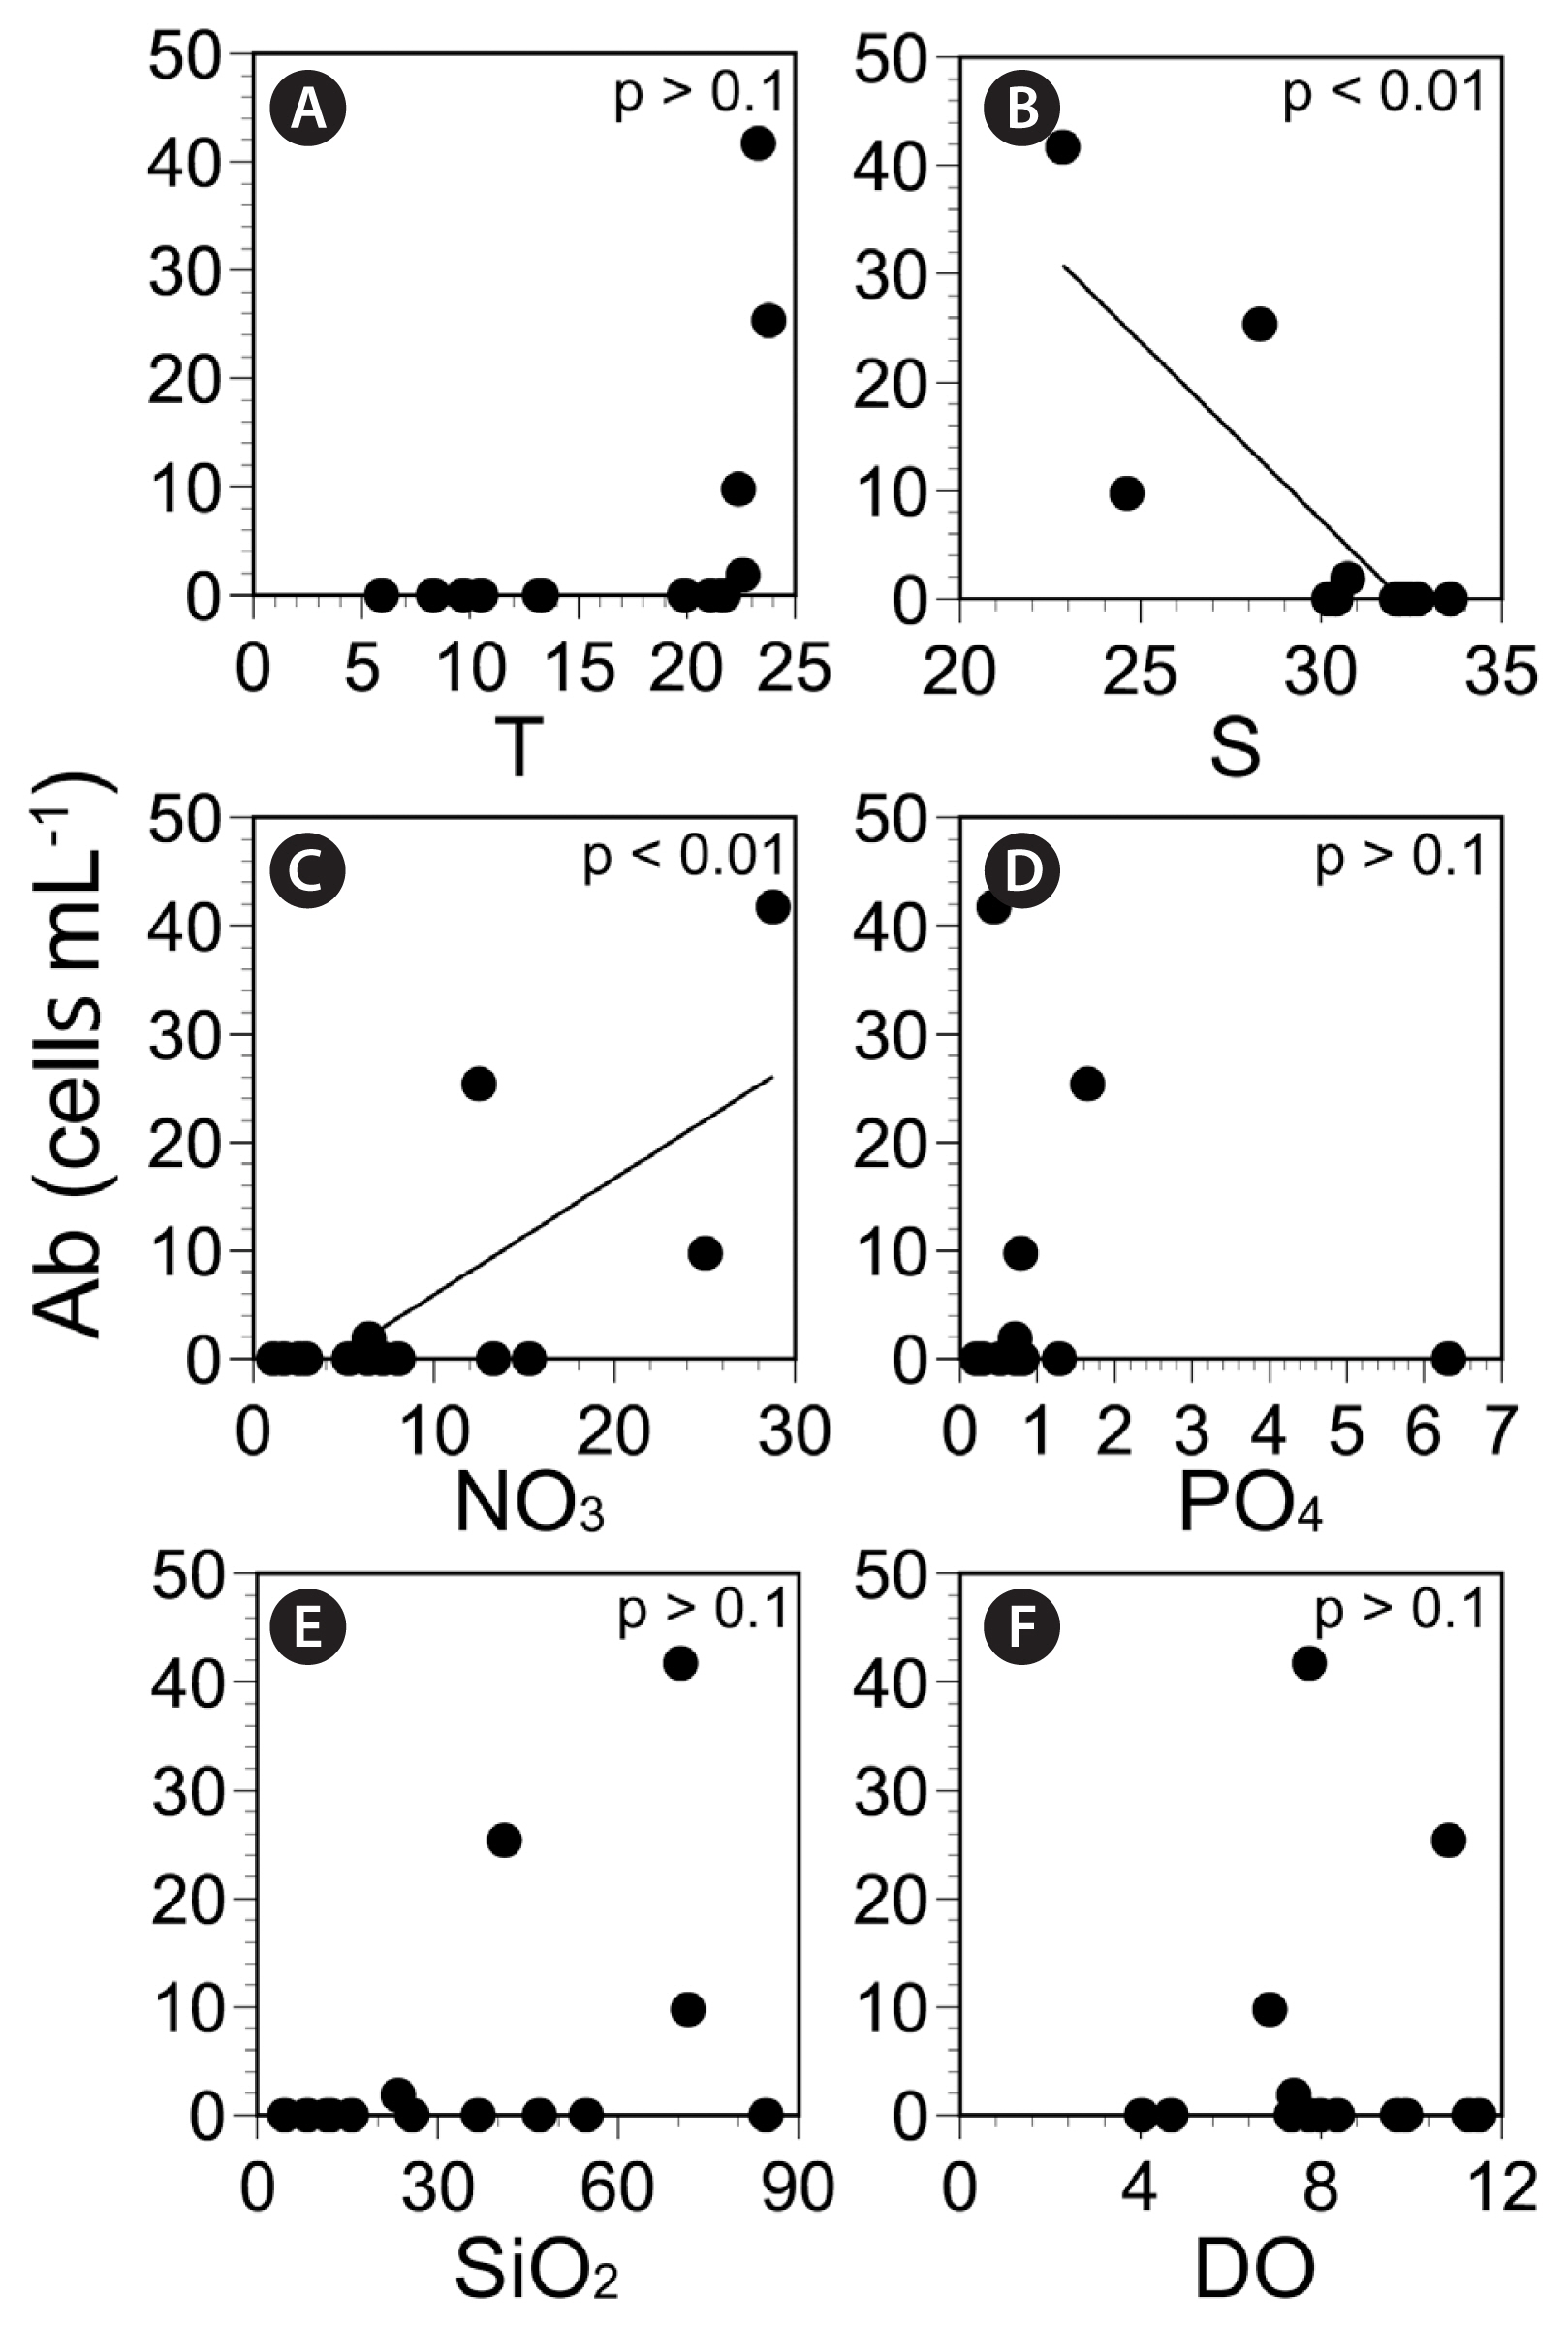
Table 1
Oligonucleotide primers used to amplify the SSU, ITS1, 5.8S, ITS2, and LSU regions of ribosomal DNA and the species-specific primers and Taq-Man probe used to determine the abundance of Biecheleriopsis adriatica using qPCR
Table 2
Mean abundance (±standard error, cells mL−1) of the vegetative cells of Biecheleriopsis adriatica recorded at each sampling station from April 2015 to December 2016 and also the maximum abundance (Max, cells mL−1) recorded at each sampling station from 2015 to 2018, quantified using quantitative real-time polymerase reactions
|
Station |
Name |
2015 |
2016 |
2015–2018 Max |
|
|
|
Apr |
Jul |
Oct |
Jan |
Mar |
Jul |
Oct |
Dec |
|
SC |
Sokcho |
- |
- |
- |
- |
- |
2.0 (1.0) |
- |
NA |
2.0 |
|
JMJ |
Jumunjin |
NA |
3.0 (2.1) |
- |
- |
- |
0.1 (0.1) |
- |
- |
4.3 |
|
DH |
Donghae |
- |
- |
- |
- |
- |
- |
- |
- |
2.4 |
|
UJ |
Uljin |
- |
- |
- |
- |
- |
- |
- |
- |
- |
|
PH |
Pohang |
- |
- |
- |
- |
- |
- |
- |
- |
- |
|
US |
Ulsan |
- |
- |
- |
- |
- |
11.1 (1.7) |
- |
- |
11.1 |
|
BS |
Busan |
- |
- |
- |
- |
- |
1.8 (0.8) |
- |
- |
1.8 |
|
DDP |
Dadaepo |
- |
- |
- |
- |
- |
2.7 (1.6) |
- |
- |
2.7 |
|
JH |
Jinhae |
NA |
- |
- |
- |
- |
1.8 (1.5) |
9.8 (4.7) |
- |
41.7 |
|
MS |
Masan |
- |
4.0 (2.5) |
- |
- |
- |
3.6 (1.7) |
- |
- |
4.0 |
|
TY |
Tongyoung |
- |
- |
- |
- |
- |
0.4 (0.4) |
- |
- |
0.4 |
|
YS |
Yeosu |
- |
- |
- |
- |
- |
- |
- |
- |
3.4 |
|
KY |
Kwangyang |
- |
- |
- |
- |
- |
- |
- |
- |
- |
|
GH |
Goheung |
NA |
- |
- |
- |
- |
- |
- |
- |
- |
|
JAH |
Jangheung |
- |
2.6 (1.7) |
- |
- |
- |
1.6 (1.0) |
- |
- |
2.6 |
|
AS |
Ansan |
- |
- |
- |
- |
- |
- |
0.1 (0.1) |
- |
1.4 |
|
DAJ |
Dangjin |
- |
- |
- |
- |
- |
1.3 (1.3) |
- |
- |
1.3 |
|
MGP |
Mageompo |
- |
2.8 (1.1) |
- |
- |
- |
2.0 (1.5) |
- |
- |
2.8 |
|
TA |
Taean |
- |
- |
0.3 (0.3) |
- |
NA |
1.0 (1.0) |
- |
- |
1.0 |
|
SCN |
Seocheon |
- |
- |
- |
- |
- |
- |
- |
- |
- |
|
KS |
Kunsan |
- |
3.7 (3.0) |
- |
- |
- |
18.3 (5.0) |
1.2 (0.8) |
- |
18.3 |
|
BA |
Buan |
- |
2.6 (2.6) |
- |
- |
- |
4.0 (1.8) |
- |
- |
4.0 |
|
MP |
Mokpo |
- |
- |
1.4 (0.9) |
- |
- |
- |
- |
- |
1.4 |
|
AW |
Aewol |
- |
- |
- |
- |
- |
1.9 (1.3) |
4.8 (2.4) |
- |
4.8 |
|
SGP |
Seogwipo |
- |
- |
- |
- |
- |
- |
- |
- |
- |
|
WM |
Wimi |
- |
- |
- |
- |
- |
- |
- |
- |
- |
|
SS |
Seongsan |
- |
- |
- |
- |
- |
- |
- |
- |
- |
|
GN |
Gimnyeong |
NA |
NA |
NA |
NA |
NA |
NA |
NA |
NA |
7.0 |
Table 3
Mean abundance (±standard error, cells mL−1) of the vegetative cells of Biecheleriopsis adriatica recorded at each sampling station from March 2017 to October 2018 and also the maximum abundance (Max, cells mL−1) recorded at each sampling station from 2015 to 2018, quantified using quantitative real-time polymerase reactions
|
Station |
Name |
2017 |
2018 |
2015–2018 Max |
|
|
|
Mar |
Jul |
Oct |
Jan |
Mar |
Jul |
Oct |
|
SC |
Sokcho |
- |
0.1 (0.1) |
- |
- |
- |
- |
- |
2.0 |
|
JMJ |
Jumunjin |
- |
4.3 (1.9) |
- |
- |
- |
2.1 (1.3) |
- |
4.3 |
|
DH |
Donghae |
- |
2.4 (1.0) |
- |
- |
- |
0.2 (0.2) |
- |
2.4 |
|
UJ |
Uljin |
- |
- |
- |
- |
- |
- |
- |
- |
|
PH |
Pohang |
- |
- |
- |
- |
- |
- |
- |
- |
|
US |
Ulsan |
- |
- |
- |
- |
- |
- |
- |
11.1 |
|
BS |
Busan |
- |
- |
- |
- |
- |
- |
- |
1.8 |
|
DDP |
Dadaepo |
- |
0.8 (0.8) |
- |
- |
- |
- |
- |
2.7 |
|
JH |
Jinhae |
- |
25.3 (7.9) |
- |
- |
- |
41.7 (9.3) |
- |
41.7 |
|
MS |
Masan |
- |
- |
- |
- |
- |
- |
- |
4.0 |
|
TY |
Tongyoung |
- |
- |
- |
- |
- |
- |
- |
0.4 |
|
YS |
Yeosu |
- |
3.4 (1.2) |
- |
- |
- |
- |
- |
3.4 |
|
KY |
Kwangyang |
- |
- |
- |
- |
- |
- |
- |
- |
|
GH |
Goheung |
- |
- |
- |
- |
- |
- |
- |
- |
|
JAH |
Jangheung |
- |
1.0 (0.5) |
- |
- |
- |
- |
- |
2.6 |
|
AS |
Ansan |
- |
1.4 (0.9) |
- |
- |
- |
NA |
- |
1.4 |
|
DAJ |
Dangjin |
- |
- |
- |
- |
- |
- |
- |
1.3 |
|
MGP |
Mageompo |
- |
- |
- |
- |
- |
- |
- |
2.8 |
|
TA |
Taean |
NA |
NA |
NA |
NA |
NA |
NA |
NA |
1.0 |
|
SCN |
Seocheon |
- |
- |
- |
- |
- |
- |
- |
- |
|
KS |
Kunsan |
- |
- |
- |
- |
- |
- |
- |
18.3 |
|
BA |
Buan |
- |
- |
- |
- |
- |
0.9 (0.8) |
- |
4.0 |
|
MP |
Mokpo |
- |
- |
- |
- |
- |
- |
- |
1.4 |
|
AW |
Aewol |
- |
- |
- |
- |
- |
- |
- |
4.8 |
|
SGP |
Seogwipo |
- |
- |
- |
- |
- |
- |
- |
- |
|
WM |
Wimi |
- |
- |
- |
- |
- |
- |
- |
- |
|
SS |
Seongsan |
- |
- |
- |
- |
- |
- |
- |
- |
|
GN |
Gimnyeong |
- |
7.0 (2.1) |
- |
- |
- |
- |
- |
7.0 |
Table 4
Pearson’s correlation coefficients for relationships between abundance of the vegetative cells of Biecheleriopsis adriatica (Ba, cells mL−1) and temperature (T, °C), salinity (S), and the concentrations of nitrate + nitrite (NO3, μM), phosphate (PO4, μM), silicate (SiO2, μM), and dissolved oxygen (DO, mg L−1) in water samples collected at each station from April 2015 to October 2018
|
Ba |
T |
S |
NO3
|
PO4
|
SiO2
|
DO |
|
Ba |
- |
0.167**
|
−0.129*
|
0.043 |
−0.004 |
0.046 |
−0.011 |
|
T |
0.167**
|
- |
−0.354**
|
0.303**
|
0.159**
|
0.348**
|
−0.614**
|
|
S |
−0.129*
|
−0.354**
|
- |
−0.666**
|
−0.219**
|
−0.626**
|
0.217**
|
|
NO3
|
0.043 |
0.303**
|
−0.666**
|
- |
0.330**
|
0.826**
|
−0.167**
|
|
PO4
|
−0.004 |
0.159**
|
−0.219**
|
0.330**
|
- |
0.300**
|
−0.311**
|
|
SiO2
|
0.046 |
0.348**
|
−0.626**
|
0.826**
|
0.300**
|
- |
−0.216**
|
|
DO |
−0.011 |
−0.614**
|
0.217**
|
−0.167**
|
−0.311**
|
−0.216**
|
- |
Table 5
Pearson’s correlation coefficients for relationships between abundance of the vegetative cells of Biecheleriopsis adriatica (Ba, cells mL−1) and temperature (T, °C), salinity (S), and the concentrations of nitrate + nitrite (NO3, μM), phosphate (PO4, μM), silicate (SiO2, μM), and dissolved oxygen (DO, mg L−1) in water samples collected in Jinhae Bay from April 2015 to October 2018
|
Ba |
T |
S |
NO3
|
PO4
|
SiO2
|
DO |
|
Ba |
- |
0.480 |
−0.835**
|
0.729**
|
−0.072 |
0.438 |
0.082 |
|
T |
0.480 |
- |
−0.628*
|
0.559*
|
0.349 |
0.508 |
−0.495 |
|
S |
−0.835**
|
−0.628*
|
- |
−0.943**
|
−0.081 |
−0.690**
|
0.164 |
|
NO3
|
0.729**
|
0.559*
|
−0.943**
|
- |
0.177 |
0.745**
|
−0.260 |
|
PO4
|
−0.072 |
0.349 |
−0.081 |
0.177 |
- |
0.204 |
−0.174 |
|
SiO2
|
0.438 |
0.508 |
−0.690**
|
0.745**
|
0.204 |
- |
−0.469 |
|
DO |
0.082 |
−0.495 |
0.164 |
−0.260 |
−0.174 |
−0.469 |
- |
Table 6
Worldwide distribution of the vegetative cells and cysts of Biecheleriopsis adriatica
|
Form/Region |
Date |
Latitude |
Temperature (°C) |
Salinity |
Reference |
|
Vegetative cells |
|
East, West, and South Sea, Korea |
Apr 2014–Oct 2018 |
33°17′ N–38°12′ N |
17.7–26.4 |
9.9–34.3 |
This study |
|
Lake Hamana, Japan |
Jun 2014 |
34°41′ N |
21.0 |
35.0 |
Benico et al. (2019)
|
|
Matsushima Bay, Japan |
Jul 2013 |
38°16′ N |
22.0 |
28.0 |
Benico et al. (2019)
|
|
Pohang, Korea |
Sep 2012 |
36°10′ N |
23.0 |
29.6 |
Jang et al. (2015)
|
|
Nabeta Bay, Japan |
Oct 2010 |
34°36′ N |
24.0 |
NA |
Takahashi et al. (2014)
|
|
Shiwha Bay, Korea |
Sep 2009 |
37°33′ N |
25.1 |
24.0 |
Jang et al. (2015)
|
|
Tongyoung, Korea |
Aug 2006 |
35°04′ N |
28.0 |
31.0 |
Jang et al. (2015)
|
|
Sado Island, Japan |
Sep 2012 |
38°04′ N |
28.4 |
NA |
Takahashi et al. (2014)
|
|
Sendai Haror, Japan |
Aug 2010 |
38°27′ N |
29.0 |
NA |
Takahashi et al. (2014)
|
|
Pacific, Palau Island |
Nov 2013 |
07°14′ N |
28.5 |
34.0 |
Benico et al. (2019)
|
|
Bolinao Channel, Philippines |
May 2016 |
16°21′ N |
31.0 |
30.0 |
Benico et al. (2019)
|
|
Bolinao Channel, Philippines |
May 2017 |
16°20′ N |
32.0 |
30.0 |
Benico et al. (2019)
|
|
Tsuruoka, Japan |
Jul, Aug 2013 |
38°45′ N |
NA |
NA |
Benico et al. (2019)
|
|
St. John’s Island, Singapore |
Jul 2016 |
01°13′ N |
NA |
30.0 |
Benico et al. (2019)
|
|
Adriatic Sea |
NA |
NA |
NA |
NA |
Moestrup et al. (2009)
|
|
Yellow Sea, China |
Apr 2012 |
34°44′ N |
NA |
NA |
Luo et al. (2015)
|
|
Cysts |
|
Zhelin Bay, China |
Nov 2008 |
NA |
NA |
NA |
Kang and Wang (2018)
|
|
Guishan Island, China |
Jan 2009 |
NA |
NA |
NA |
Kang and Wang (2018)
|
|
Yellow Sea, China |
Apr 2011 |
39°15′ N |
NA |
NA |
Luo et al. (2015)
|
|
Yellow Sea, China |
May 2011 |
34°48′ N |
NA |
NA |
Luo et al. (2015)
|
|
South China Sea |
May 2010 |
21°29′ N |
NA |
NA |
Luo et al. (2015)
|
|
South China Sea |
Jun, Jul 2011 |
21°29′ N |
NA |
NA |
Luo et al. (2015)
|
|
South China Sea |
Jun 2012 |
21°29′ N |
NA |
NA |
Luo et al. (2015)
|
|
Black Sea |
NA |
NA |
NA |
NA |
Dzhembekova et al. (2018)
|
Appendix 1
List of dinoflagellate species used to determine primer specificity
|
Species |
Strain name |
Location of collection |
Accession number (ITS) |
|
Biecheleriopsis adriatica
|
BATY06 |
Tongyoung, Korea |
LM992906 |
|
Biecheleriopsis adriatica
|
BAPH12 |
Pohang, Korea |
LM992904 |
|
Biecheleriopsis adriatica
|
BASW09 (= BASH09) |
Shiwha, Korea |
LM992905 |
|
Ansanella granifera
|
AGSW10 |
Shiwha, Korea |
HG529979 |
|
Biecheleria cincta
|
BCSW0906 |
Shiwha, Korea |
FR690459 |
|
Gymnodinium smaydae
|
GSSW10 |
Shiwha, Korea |
HG005135 |
|
Paragymnodinium shiwhaense
|
PSSH0605 |
Shiwha, Korea |
AM408889 |
|
Pelagodinium bei
|
HJ-2010 |
Shiwha, Korea |
KP342301 |
|
Effrenium voratum
|
SvFL 1 |
Jeju, Korea |
HF568830 |
|
Yihiella yeosuensis
|
YY1405 |
Yeosu, Korea |
LN898222 |
|
Luciella masanensis
|
LMJH1607 (Masan Lucy200505) |
Jinhae, Korea |
AM050344 |
|
Pfiesteria piscicida
|
CCMP2091 |
Neuse River, USA |
DQ344043 |
Appendix 2
The range of temperatures and salinities recorded from April 2015 to October 2018 at all sampling stations at which water samples were collected (ASW), and at the stations at which vegetative cells of Biecheleriopsis adriatica were detected (SBD)
|
Station |
Name |
Temperature (°C) |
Salinity |
|
|
|
ASW |
SBD |
ASW |
SBD |
|
SC |
Sokcho |
5.2–21.6 |
19.7–21.6 |
31.2–34.3 |
33.0–33.4 |
|
JMJ |
Jumunjin |
5.4–21.2 |
18.9–21.2 |
30.2–33.8 |
30.3–33.7 |
|
DH |
Donghae |
6.8–22.9 |
19.7–22.5 |
30.1–34.2 |
30.5–33.1 |
|
UJ |
Uljin |
9.2–22.9 |
- |
31.2–34.6 |
- |
|
PH |
Pohang |
9.2–23.5 |
- |
22.0–34.4 |
- |
|
US |
Ulsan |
10.2–23.8 |
19.4 |
30.2–34.4 |
33.8 |
|
BS |
Busan |
10.5–23.5 |
17.7 |
23.2–34.3 |
32.5 |
|
DDP |
Dadaepo |
7.3–23.1 |
19.4–21.4 |
26.3–34.2 |
26.3–32.3 |
|
JH |
Jinhae |
5.9–23.8 |
22.4–23.8 |
22.8–33.6 |
22.8–30.7 |
|
MS |
Masan |
5.6–24.0 |
22.3–24.0 |
9.9–33.0 |
9.9–25.3 |
|
TY |
Tongyoung |
1.1–22.3 |
22.0 |
21.8–33.4 |
32.8 |
|
YS |
Yeosu |
4.4–26.4 |
26.4 |
27.1–33.6 |
30.1 |
|
KY |
Kwangyang |
7.4–27.1 |
- |
0.1–33.2 |
- |
|
GH |
Goheung |
2.3–26.1 |
- |
19.4–34.0 |
- |
|
JAH |
Jangheung |
3.8–24.7 |
23.0–24.3 |
26.4–33.1 |
26.4–31.0 |
|
AS |
Ansan |
1.7–25.6 |
19.8–25.6 |
21.1–34.3 |
30.3–34.3 |
|
DAJ |
Dangjin |
0.2–28.0 |
24.9 |
24.7–32.5 |
24.7 |
|
MGP |
Mageompo |
1.9–23.6 |
23.0–23.6 |
31.0–35.6 |
31.5–31.6 |
|
TA |
Taean |
6.0–24.1 |
19.4–23.9 |
28.8–35.1 |
28.8–32.8 |
|
SCN |
Seocheon |
0.2–27.0 |
- |
19.5–34.5 |
- |
|
KS |
Kunsan |
1.8–23.8 |
21.8–23.2 |
29.3–33.9 |
29.3–33.8 |
|
BA |
Buan |
2.2–25.0 |
23.9–24.8 |
11.5–34.1 |
22.8–29.4 |
|
MP |
Mokpo |
5.0–25.8 |
21.5 |
9.6–33.6 |
30.7 |
|
AW |
Aewol |
12.5–24.3 |
20.0–23.5 |
22.7–33.1 |
23.6–26.7 |
|
SGP |
Seogwipo |
14.8–24.2 |
- |
17.5–33.1 |
- |
|
WM |
Wimi |
14.0–23.6 |
- |
20.8–33.8 |
- |
|
SS |
Seongsan |
11.5–25.5 |
- |
29.9–34.3 |
- |
|
GN |
Gimnyeong |
10.8–24.5 |
24.5 |
20.0–31.9 |
20.0 |
|
Total |
0.2–28.0 |
17.7–26.4 |
0.1–35.6 |
9.9–34.3 |
Appendix 3
The range of nitrite + nitrate (NO3), phosphate (PO4), and silicate (SiO2) concentrations recorded from April 2015 to October 2018 at all sampling stations at which water samples were collected (ASW), and at the stations at which the vegetative cells of Biecheleriopsis adriatica were detected (SBD)
|
Station |
Name |
NO3 (μM) |
PO4 (μM) |
SiO2 (μM) |
|
|
|
|
ASW |
SBD |
ASW |
SBD |
ASW |
SBD |
|
SC |
Sokcho |
0.2–6.8 |
0.2–1.4 |
0.03–6.06 |
0.20–0.26 |
0.6–24.7 |
2.4–14.1 |
|
JMJ |
Jumunjin |
1.0–11.5 |
1.0–6.5 |
0.18–2.17 |
0.18–0.69 |
1.9–59.7 |
6.6–29.3 |
|
DH |
Donghae |
2.0–14.2 |
4.9–6.6 |
0.10–0.98 |
0.20–0.27 |
6.1–51.1 |
16.3–20.8 |
|
UJ |
Uljin |
0.8–43.6 |
- |
0.14–1.39 |
- |
2.7–35.2 |
- |
|
PH |
Pohang |
0.9–63.0 |
- |
0.03–0.80 |
- |
10.8–232.1 |
- |
|
US |
Ulsan |
ND–10.8 |
ND |
0.15–1.37 |
0.21 |
4.3–38.2 |
4.3 |
|
BS |
Busan |
2.8–26.5 |
2.8 |
0.39–1.87 |
0.59 |
13.7–140.4 |
23.0 |
|
DDP |
Dadaepo |
2.9–29.2 |
7.4–29.2 |
0.05–4.22 |
0.72–0.93 |
3.5–64.4 |
14.0–44.8 |
|
JH |
Jinhae |
1.1–28.8 |
6.4–28.8 |
0.22–6.31 |
0.44–1.65 |
4.5–84.6 |
23.3–71.6 |
|
MS |
Masan |
0.7–91.9 |
18.7–91.9 |
0.17–3.38 |
0.72–2.66 |
4.1–316.6 |
57.4–316.6 |
|
TY |
Tongyoung |
0.4–42.0 |
17.6 |
0.01–2.83 |
1.10 |
5.4–178.4 |
63.1 |
|
YS |
Yeosu |
0.8–26.4 |
2.9 |
0.19–1.13 |
0.19 |
ND–64.0 |
29.3 |
|
KY |
Kwangyang |
2.7–102.9 |
- |
0.08–3.45 |
- |
6.6–243.2 |
- |
|
GH |
Goheung |
0.9–34.6 |
- |
0.18–1.34 |
- |
7.4–105.9 |
- |
|
JAH |
Jangheung |
0.4–17.5 |
5.2–12.6 |
ND–1.02 |
0.52–0.83 |
0.0–81.1 |
44.4–65.8 |
|
AS |
Ansan |
2.8–22.7 |
3.3–20.0 |
ND–1.78 |
0.19–1.78 |
0.6–65.9 |
20.6–48.6 |
|
DAJ |
Dangjin |
12.1–42.7 |
31.4 |
0.01–2.18 |
1.76–1.76 |
1.2–83.3 |
67.0 |
|
MGP |
Mageompo |
0.1–10.7 |
1.7–5.0 |
ND–0.93 |
0.44–0.86 |
ND–41.6 |
32.0–37.2 |
|
TA |
Taean |
1.6–10.7 |
4.4–8.0 |
0.14–1.66 |
1.43–1.66 |
1.2–82.7 |
54.7–82.8 |
|
SCN |
Seocheon |
0.7–42.4 |
- |
0.01–1.99 |
- |
3.1–117.7 |
- |
|
KS |
Kunsan |
1.0–41.4 |
3.3–8.7 |
ND–1.66 |
0.52–1.19 |
ND–53.6 |
31.3–50.5 |
|
BA |
Buan |
1.2–118.3 |
13.9–44.7 |
0.24–4.67 |
1.06–1.47 |
2.6–245.2 |
62.7–130.9 |
|
MP |
Mokpo |
2.4–106.0 |
14.2 |
0.14–6.26 |
1.14 |
2.0–236.3 |
38.4 |
|
AW |
Aewol |
8.0–96.2 |
24.7–96.2 |
0.18–2.66 |
0.34–2.66 |
30.6–273.0 |
132.7–273.0 |
|
SGP |
Seogwipo |
10.2–149.0 |
- |
0.21–3.59 |
- |
21.5–453.4 |
- |
|
WM |
Wimi |
8.2–82.8 |
- |
0.41–1.09 |
- |
19.2–279.3 |
- |
|
SS |
Seongsan |
4.5–86.4 |
- |
0.27–0.92 |
- |
16.7–109.1 |
- |
|
GN |
Gimnyeong |
9.1–89.0 |
59.6 |
0.46–1.50 |
1.23 |
40.9–448.4 |
448.4 |
|
Total |
ND–149.0 |
ND–96.2 |
ND–6.31 |
0.18–2.66 |
ND–453.4 |
2.4–448.4 |
REFERENCES
Adolf, JE., Bachvaroff, TR., Deeds, JR. & Place, AR. 2015. Ichthyotoxic Karlodinium veneficum (Ballantine) J Larsen in the upper Swan River estuary (Western Australia): ecological conditions leading to a fish kill. Harmful Algae. 48:83–93.    Benico, GA., Takahashi, K., Lum, WM., Yñiguez, AT., Azanza, RV., Leong, SCY., Lim, PT. & Iwataki, M. 2019. First report of Biecheleriopsis adriatica in Bolinao, Northwestern Philippines and its wide distribution in Southeast Asia and adjacent waters. Philipp J Nat Sci. 24:34–41.
Bowers, HA., Tengs, T., Glasgow, HB. Jr, Burkholder, JM., Rublee, PA. & Oldach, DW. 2000. Development of real-time PCR assays for rapid detection of Pfiesteria piscicida and related dinoflagellates. Appl Environ Microbiol. 66:4641–4648. Daugbjerg, N., Hansen, G., Larsen, J. & Moestrup, Ø. 2000. Phylogeny of some of the major genera of dinoflagellates based on ultrastructure and partial LSU rDNA sequence data, including the erection of three new genera of unarmoured dinoflagellates. Phycologia. 39:302–317. Dzhembekova, N., Moncheva, S., Ivanova, P., Slabakova, N. & Nagai, S. 2018. Biodiversity of phytoplankton cyst assemblages in surface sediments of the Black Sea based on metabarcoding. Biotechnol Biotechnol Equip. 32:1507–1513. Godhe, A., Asplund, ME., Härnström, K., Saravanan, V., Tyagi, A. & Karunasagar, I. 2008. Quantification of diatom and dinoflagellate biomasses in coastal marine seawater samples by real-time PCR. Appl Environ Microbiol. 74:7174–7182. Hallegraeff, GM. 1993. A review of harmful algal blooms and their apparent global increase. Phycologia. 32:79–99. Hallegraeff, GM. 1998. Transport of toxic dinoflagellates via ships’ ballast water: bioeconomic risk assessment and efficacy of possible ballast water management strategies. Mar Ecol Prog Ser. 168:297–309.  Hansen, PJ. 2011. The role of photosynthesis and food uptake for the growth of marine mixotrophic dinoflagellates. J Eukaryot Microbiol. 58:203–214. Heaney, SI. & Eppley, RW. 1981. Light, temperature and nitrogen as interacting factors affecting diel vertical migrations of dinoflagellates in culture. J Plankton Res. 3:331–344. Jang, SH., Jeong, HJ., Moestrup, Ø., Kang, NS., Lee, SY., Lee, KH., Lee, MJ. & Noh, JH. 2015. Morphological, molecular and ecophysiological characterization of the phototrophic dinoflagellate Biecheleriopsis adriatica from Korean coastal waters. Eur J Phycol. 50:301–317. Jang, SH., Jeong, HJ., Moestrup, Ø., Kang, NS., Lee, SY., Lee, KH. & Seong, KA. 2017. Yihiella yeosuensis gen. et sp. nov. (Suessiaceae, Dinophyceae), a novel dinoflagellate isolated from the coastal waters of Korea. J Phycol. 53:131–145. Jeong, HJ., Jang, SH., Moestrup, Ø., Kang, NS., Lee, SY., Potvin, E. & Noh, JH. 2014a. Ansanella granifera gen. et sp. nov. (Dinophyceae), a new dinoflagellate from the coastal waters of Korea. Algae. 29:75–99. Jeong, HJ., Kang, HC., You, JH. & Jang, SH. 2018a. Interactions between the newly described small- and fast-swimming mixotrophic dinoflagellate Yihiella yeosuensis and common heterotrophic protists. J Eukaryot Microbiol. 65:612–626. Jeong, HJ., Lee, KH., Yoo, YD., Kang, NS., Song, JY., Kim, TH., Seong, KA., Kim, JS. & Potvin, E. 2018b. Effects of light intensity, temperature, and salinity on the growth and ingestion rates of the red-tide mixotrophic dinoflagellate Paragymnodinium shiwhaense. Harmful Algae. 80:46–54. Jeong, HJ., Lee, SY., Kang, NS., Yoo, YD., Lim, AS., Lee, MJ., Kim, HS., Yih, W., Yamashita, H. & LaJeunesse, TC. 2014b. Genetics and morphology characterize the dinoflagellate Symbiodinium voratum, n. sp., (Dinophyceae) as the sole representative of Symbiodinium clade E. J Eukaryot Microbiol. 61:75–94. Jeong, HJ., Lim, AS., Franks, PJS., Lee, KH., Kim, JH., Kang, NS., Lee, MJ., Jang, SH., Lee, SY., Yoon, EY., Park, JY., Yoo, YD., Seong, KA., Kwon, JE. & Jang, TY. 2015. A hierarchy of conceptual models of red-tide generation: nutrition, behavior, and biological interactions. Harmful Algae. 47:97–115. Jeong, HJ., Lim, AS., Lee, K., Lee, MJ., Seong, KA., Kang, NS., Jang, SH., Lee, KH., Lee, SY., Kim, MO., Kim, JH., Kwon, JE., Kang, HC., Kim, JS., Yih, W., Shin, K., Jang, PK., Ryu, J-H., Kim, SY., Park, JY. & Kim, KY. 2017. Ichthyotoxic Cochlodinium polykrikoides red tides offshore in the South Sea, Korea in 2014: I. temporal variations in three-dimensional distributions of red-tide organisms and environmental factors. Algae. 32:101–130. Jeong, HJ., Yoo, YD., Kim, JS., Seong, KA., Kang, NS. & Kim, TH. 2010. Growth, feeding, and ecological roles of the mixotrophic and heterotrophic dinoflagellates in marine planktonic food webs. Ocean Sci J. 45:65–91. Jeong, HJ., Yoo, YD., Lee, KH., Kim, TH., Seong, KA., Kang, NS., Lee, SY., Kim, JS., Kim, S. & Yih, WH. 2013. Red tides in Masan bay, Korea in 2004–2005: I. daily variations in the abundance of red-tide organisms and environmental factors. Harmful Algae. 30(Suppl 1):S75–S88. Johnson, MD. 2015. Inducible mixotrophy in the dinoflagellate Prorocentrum minimum. J Eukaryot Microbiol. 62:431–443. Kang, HC., Jeong, HJ., Kim, SJ., You, JH. & Ok, JH. 2018. Differential feeding by common heterotrophic protists on 12 different Alexandrium species. Harmful Algae. 78:106–117. Kang, NS., Jeong, HJ., Moestrup, Ø., Lee, SY., Lim, AS., Jang, TY., Lee, KH., Lee, MJ., Jang, SH., Potvin, E., Lee, SK. & Noh, JH. 2014. Gymnodinium smaydae n. sp., a new planktonic phototrophic dinoflagellate from the coastal waters of western Korea: morphology and molecular characterization. J Eukaryot Microbiol. 61:182–203. Kang, NS., Jeong, HJ., Moestrup, Ø., Shin, W., Nam, SW., Park, JY., De Salas, MF., Kim, KW. & Noh, JH. 2010. Description of a new planktonic mixotrophic dinoflagellate Paragymnodinium shiwhaense n. gen., n. sp. from the coastal waters off western Korea: morphology, pigments, and ribosomal DNA gene sequence. J Eukaryot Microbiol. 57:121–144. Kang, NS., Jeong, HJ., Yoo, YD., Yoon, EY., Lee, KH., Lee, K. & Kim, G. 2011. Mixotrophy in the newly described phototrophic dinoflagellate Woloszynskia cincta from western Korean waters: feeding mechanism, prey species and effect of prey concentration. J Eukaryot Microbiol. 58:152–170. Kang, W. & Wang, Z-H. 2018. Identification of a marine woloszynskioid dinoflagellate Biecheleriopsis adriatica and germination of its cysts from southern Chinese coasts. J Environ Sci. 66:246–254. Kremp, A., Tamminen, T. & Spilling, K. 2008. Dinoflagellate bloom formation in natural assemblages with diatoms: nutrient competition and growth strategies in Baltic spring phytoplankton. Aquat Microb Ecol. 50:181–196. LaJeunesse, TC., Parkinson, JE., Gabrielson, PW., Jeong, HJ., Reimer, JD., Voolstra, CR. & Santos, SR. 2018. Systematic revision of Symbiodiniaceae highlights the antiquity and diversity of coral endosymbionts. Curr Biol. 28:2570–2580. Landsberg, JH. 2002. The effects of harmful algal blooms on aquatic organisms. Rev Fish Sci. 10:113–390. Lee, KH., Jeong, HJ., Kim, HJ. & Lim, AS. 2017a. Nitrate uptake of the red tide dinoflagellate Prorocentrum micans measured using a nutrient repletion method: effect of light intensity. Algae. 32:139–153. Lee, SY., Jeong, HJ., Kwon, JE., You, JH., Kim, SJ., Ok, JH., Kang, HC. & Park, JY. 2019. First report of the photosynthetic dinoflagellate Heterocapsa minima in the Pacific Ocean: morphological and genetic characterizations and the nationwide distribution in Korea. Algae. 34:7–21. Lee, SY., Jeong, HJ., Seong, KA., Lim, AS., Kim, JH., Lee, KH., Lee, MJ. & Jang, SH. 2017b. Improved real-time PCR method for quantification of the abundance of all known ribotypes of the ichthyotoxic dinoflagellate Cochlodinium polykrikoides by comparing 4 different preparation methods. Harmful Algae. 63:23–31. Lindberg, K., Moestrup, Ø. & Daugbjerg, N. 2005. Studies on woloszynskioid dinoflagellates I: Woloszynskia coronata re-examined using light and electron microscopy and partial LSU rDNA sequences, with description of Tovellia gen. nov. and Jadwigia gen. nov. (Tovelliaceae fam. nov.). Phycologia. 44:416–440. Litaker, RW., Vandersea, MW., Faust, MA., Kibler, SR., Nau, AW., Holland, WC., Chinain, M., Holmes, MJ. & Tester, PA. 2010. Global distribution of ciguatera causing dinoflagellates in the genus Gambierdiscus. Toxicon. 56:711–730. Litaker, RW., Vandersea, MW., Kibler, SR., Reece, KS., Stokes, NA., Steidinger, KA., Millie, DF., Bendis, BJ., Pigg, RJ. & Tester, PA. 2003. Identification of Pfiesteria piscicida (Dinophyceae) and Pfiesteria-like organisms using internal transcribed spacer-specific PCR assays. J Phycol. 39:754–761. Luo, Z., Yang, W., Xu, B., Zheng, B. & Gu, H. 2015. Morphology, ultrastructure, and phylogeny of Protodinium simplex and Biecheleriopsis cf. adriatica (Dinophyceae) from the China Sea. Nova Hedwigia. 101:251–268. Medlin, L., Elwood, HJ., Stickel, S. & Sogin, ML. 1988. The characterization of enzymatically amplified eukaryotic 16S-like rRNA-coding regions. Gene. 71:491–499. Menden-Deuer, S. & Montalbano, AL. 2015. Bloom formation potential in the harmful dinoflagellate Akashiwo sanguinea: clues from movement behaviors and growth characteristics. Harmful Algae. 47:75–85. Moestrup, Ø., Lindberg, K. & Daugbjerg, N. 2009. Studies on woloszynskioid dinoflagellates V. ultrastructure of Biecheleriopsis gen. nov., with description of Biecheleriopsis adriatica sp. nov. Phycol Res. 57:221–237. Olenina, I., Wasmund, N., Hajdu, S., Jurgensone, I., Gromisz, S., Kownacka, J., Toming, K., Vaiciūtė, D. & Olenin, S. 2010. Assessing impacts of invasive phytoplankton: the Baltic Sea case. Mar Pollut Bull. 60:1691–1700. Park, MG., Yih, W. & Coats, DW. 2004. Parasites and phytoplankton, with special emphasis on dinoflagellate infections. J Eukaryot Microbiol. 51:145–155. Park, TG., Lim, WA., Park, YT., Lee, CK. & Jeong, HJ. 2013. Economic impact, management and mitigation of red tides in Korea. Harmful Algae. 30(Suppl 1):S131–S143. San Diego-McGlone, ML., Azanza, RV., Villanoy, CL. & Jacinto, GS. 2008. Eutrophic waters, algal bloom and fish kill in fish farming areas in Bolinao, Pangasinan, Philippines. Mar Pollut Bull. 57:295–301. Scholin, CA., Herzog, M., Sogin, M. & Anderson, DM. 1994. Identification of group- and strain-specific genetic markers for globally distributed Alexandrium (Dinophyceae). II. sequence analysis of a fragment of the LSU rRNA gene. J Phycol. 30:999–1011. Selina, MS. & Levchenko, EV. 2011. Species composition and morphology of dinoflagellates (Dinophyta) of epiphytic assemblages of Peter the Great Bay in the Sea of Japan. Russ J Mar Biol. 37:23–32. Siano, R., Kooistra, WHCF., Montresor, M. & Zingone, A. 2009. Unarmoured and thin-walled dinoflagellates from the Gulf of Naples, with the description of Woloszynskia cincta sp. nov. (Dinophyceae, Suessiales). Phycologia. 48:44–65. Singh, SP. & Singh, P. 2015. Effect of temperature and light on the growth of algae species: a review. Renew Sustain Energy Rev. 50:431–444. Smayda, TJ. 1997. Harmful algal blooms: their ecophysiology and general relevance to phytoplankton blooms in the sea. Limnol Oceanogr. 42:1137–1153. Smayda, TJ. & Reynolds, CS. 2003. Strategies of marine dinoflagellate survival and some rules of assembly. J Sea Res. 49:95–106. Stoecker, DK., Hansen, PJ., Caron, DA. & Mitra, A. 2017. Mixotrophy in the marine plankton. Annu Rev Mar Sci. 9:311–335. Takahashi, K., Sarai, C. & Iwataki, M. 2014. Morphology of two marine woloszynskioid dinoflagellates, Biecheleria brevisulcata sp. nov. and Biecheleriopsis adriatica (Suessiaceae, Dinophyceae), from Japanese coasts. Phycologia. 53:52–65. Taylor, FJR., Hoppenrath, M. & Saldarriaga, JF. 2008. Dinoflagellate diversity and distribution. Biodivers Conserv. 17:407–418. Telesh, IV., Schubert, H. & Skarlato, SO. 2016. Ecological niche partitioning of the invasive dinoflagellate Prorocentrum minimum and its native congeners in the Baltic Sea. Harmful Algae. 59:100–111. Tillmann, U. 2004. Interactions between planktonic microalgae andprotozoan grazers. J Eukaryot Microbiol. 51:156–168. Warner, ME., LaJeunesse, TC., Robison, JD. & Thur, RM. 2006. The ecological distribution and comparative photobiology of symbiotic dinoflagellates from reef corals in Belize: potential implications for coral bleaching. Limnol Oceanogr. 51:1887–1897.
|
|